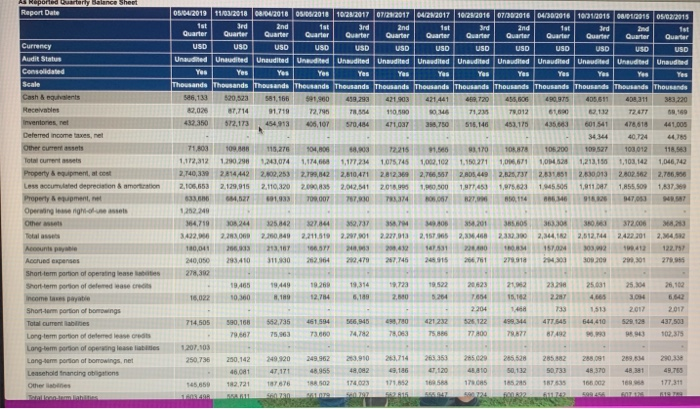
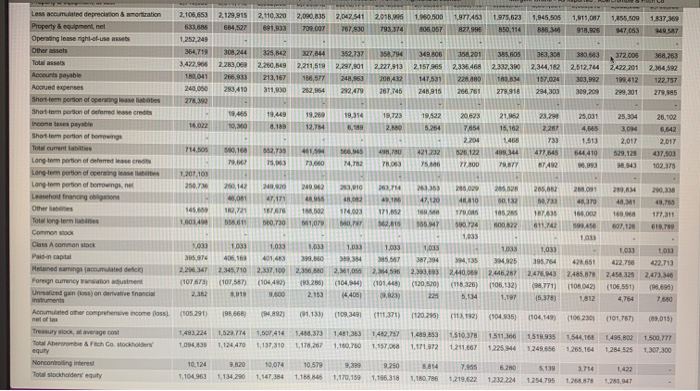
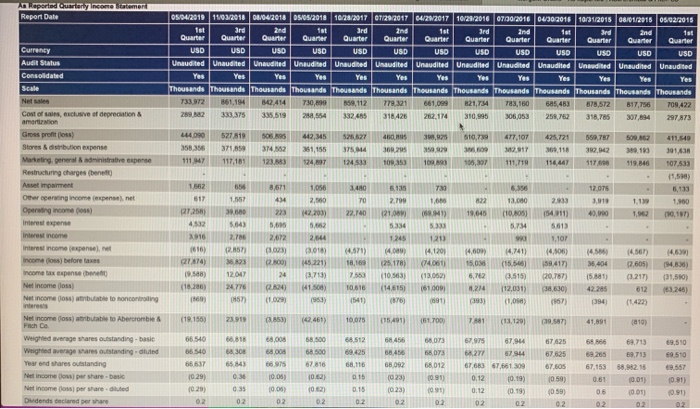
someone please help me with numbers 1-6. the balance sheet and income statement is below. The balance sheet is broke up into two picture.
balance sheet
balance sheet
income statement
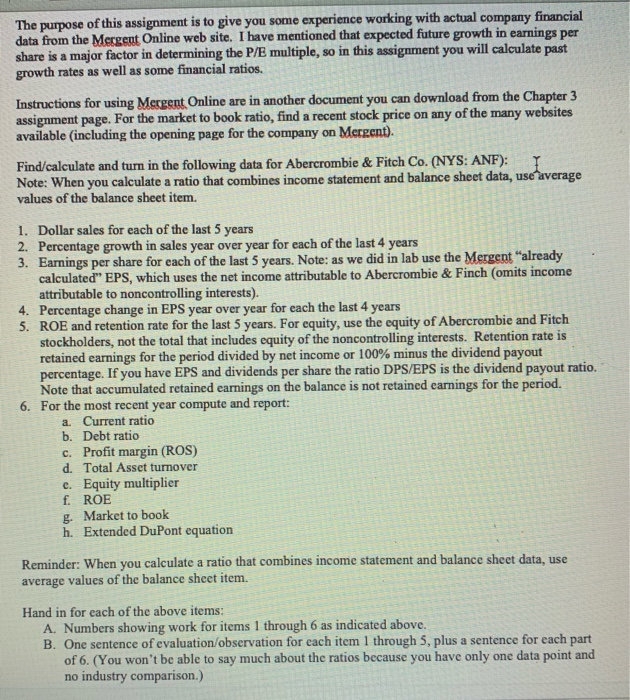
The purpose of this assignment is to give you some experience working with actual company financial data from the Mergent Online web site. I have mentioned that expected future growth in earnings per share is a major factor in determining the P/E multiple, so in this assignment you will calculate past growth rates as well as some financial ratios. Instructions for using Mergent Online are in another document you can download from the Chapter 3 assignment page. For the market to book ratio, find a recent stock price on any of the many websites available (including the opening page for the company on Mergent). Find/calculate and turn in the following data for Abercrombie & Fitch Co. (NYS: ANF): Note: When you calculate a ratio that combines income statement and balance sheet data, use average values of the balance sheet item. 1. Dollar sales for each of the last 5 years 2. Percentage growth in sales year over year for each of the last 4 years 3. Earnings per share for each of the last 5 years. Note: as we did in lab use the Mergent "already calculated" EPS, which uses the net income attributable to Abercrombie & Finch (omits income attributable to noncontrolling interests). 4. Percentage change in EPS year over year for each the last 4 years 5. ROE and retention rate for the last 5 years. For equity, use the equity of Abercrombie and Fitch stockholders, not the total that includes equity of the noncontrolling interests. Retention rate is retained earnings for the period divided by net income or 100% minus the dividend payout percentage. If you have EPS and dividends per share the ratio DPS/EPS is the dividend payout ratio. Note that accumulated retained earnings on the balance is not retained earnings for the period. 6. For the most recent year compute and report: a. Current ratio b. Debt ratio c. Profit margin (ROS) d. Total Asset turnover e. Equity multiplier f. ROE g. Market to book h. Extended DuPont equation Reminder: When you calculate a ratio that combines income statement and balance sheet data, use average values of the balance sheet item. Hand in for each of the above items: A. Numbers showing work for items 1 through 6 as indicated above. B. One sentence of evaluation/observation for each item 1 through 5, plus a sentence for each part of 6. (You won't be able to say much about the ratios because you have only one data point and no industry comparison.) Report Date 05/04/2013 1012018 08/04/2018 2018 1020/2017 2 017 04/ 2017 10/ 2 010 2010 2010 10912015 0801/2015 02/2015 Currency 30 30 Und VAO Und 10 MOI VOI 30 m USO Unded Und United United Unkuded Und Unaved United United Und Uns Candidated Scale Cash & quants Recea Thousands Thousands Thousands Thousands Thousands Thousands Thousands Thousands Thousands Thousands Thousands Thousands Thousands 581.166 591 900 459.293 21.903 47.441 2002 87.714 1719 72.75 R 1100 12 12 10 132 454 13 05.107 570.484 4 S 5 51.146452175 45.63601541 478.618 441.00 Deferred income nel Other Our Total current sets Property & equipment, al cost Less accumulated depreciation & amortion Property Appment, net Operwinging Others 104,806 174, 2,799,142 2.000.835 0.007 8.08 177,24 2,810,471 20121 7330 72 215 1. 1045 1003,102 2812,6 2,766,67 20 1 500 34 N A 1.170 10211 2.105.44 197,45) W 006710 45 2,025.737 7.623 145.506 1213,150 2.630013 1911 7 1826 1,103,142 2.802.562 1.855.500 447 | 1,046,142 2,786.900 1.8379 4 | 71.803 So. 115.276 1.172,312 1.200.298 23,074 2,140,339 2.14442 2.602,253 2.100.053 2.120,015 2.110,320 4. 01.03 1202.240 114,719 244 25842 342200 2 00 200 140 10.041 3 713,187 240,050 3410 11.00 00 844 2.211.39 2.73 2.2970 3 7 2227 013 201 468 3.0 23 36.305 ,34412.512.144 372.006 2.422.301 2,15 2, 2 6,2 2.45 122.197 282.64 29.470 275 2 Accrued expenses Short term portion of personas Short-term portion of water come este Short portion of bo n gs 18.022 100 714505 0.166 1023 Longtemps 2507 Longmoon of bong Leasehold og 01 TTI 26 2.106.653 2.129 915 2110 200 200 KS 2,042 541 2015 10500 117450 97,623 .45.505 1911 09 17 684 527 103 79 DOT 7 930 3 314 305 DST BZ7.995 Property Operating Opera ornet senghituse 1.252,249 372.00 263 2,211,519 2.281,301 2.21.13 2.15705 2,336.468 3.422.36 180.041 2.263,089 266,33 293,410 15.542 2008 213.167 311,00 2,422 201 2364,592 H . 279.95 282,954 282.479 287 146 248.915 309209 Accounts payable Acred expenses Short-term portion of operang Shortcem portion of offered secrets 8.49 19.314 1.223 522 25 24 1.513 644 410 2017 52178 28.02 6.542 2017 Or 10237 PS KAN . 205,02 24,00 47,171 48,31 Long tom perio d er Long-term portion of operatings Long term portion of borrowing.net Leasehold francing on Others Totoong termes Common Class A common 2012 43 16.00 3.456 171M2 TO T7630 177,311 55.01 0.730 1,07 0 4 160 2 405.10 2. (109 ) 599 1.433 237.100 2 (1044) .800 .354 1,056 2 (104 ) 2 (101.44 06 135 3.754 4.61 24000 242 243 24858 (1825) 1032 1004) 15.37 1812 (120.00) 2.75 2.45 (106551) 4,754 2.713 2.473 1.695) 7.60 Undan son deren 105201) 0.66 ) 91.133 (109.349) (111,371) 1120280) (1 112) (1046) 104,149) (106230) (101787) (08.015) Acumulated other comprehensive income nel of Treasury average cost 1483224 1049 1522.714 1240 414 1,137310 4.375 111 1401363 1100.750 1482.757 1.157 1.430153 1 2 1510.378 1511 211.667 1225 151 286 5 44168 265.164 1495.2 1234 525 500,777 302 300 10 0 10579 3814 5 3714 10.124 104 1 1 170159 11 42 2014 29.02 n come Agapor Report Date Currency Auct Status Consolidated 05/04/2010 19012018 01/04/2018 1/2018 10/202017 07122017 04/20/2017 10/2/2010 10/2010 04.2018 7/2015 0401/2015 05/02/2015 Gute Quart Quw Quarter Qua QwQuin d e 10T SOI COI L VS3 CS3 9 10 10 10 90 United United United United Unaudited United United United United United United United Unaudited Yes YesYesYesYes Yes Thousands Thousands Thousand Thousands Thousands Thousands Thousands Thousands Thousands Theunde Thousands Thousands Thousands 732 861.1 0.414 730,- 5.112 61,099 1,734 10 685,43 78,572 817,756 708,422 3151519 255425 114 05 06 053 252 318. 75 3074 297 873 477,107 4.721 5. 5097 411 449 118 13 3915 119.846 07513 (1.518) 2015 3,819 1.00 1,139 1,900 Cost of we of option & amor Gross proto Stores & bon expense Marting general rative expense Restructuring charges (en ) Asset Impament Other person income pense net Operating income ) Interest expense Interest income Interest income expensele income foss) before taxes Income tax expense bent Net income oss Not income o t oncong 1,962 0.1977 154.311) 5613 14120 14.06) 1458 (2.605) 217) 612 11422 14.63) 1948) 31.590) 3.24 Netcome out Aber 10 se 519 Wege ge s tanding Weid average are standing and we ding 540 265 67153 13 2.18 12 6760 557 income per shared 09 35 01) 191) > The purpose of this assignment is to give you some experience working with actual company financial data from the Mergent Online web site. I have mentioned that expected future growth in earnings per share is a major factor in determining the P/E multiple, so in this assignment you will calculate past growth rates as well as some financial ratios. Instructions for using Mergent Online are in another document you can download from the Chapter 3 assignment page. For the market to book ratio, find a recent stock price on any of the many websites available (including the opening page for the company on Mergent). Find/calculate and turn in the following data for Abercrombie & Fitch Co. (NYS: ANF): Note: When you calculate a ratio that combines income statement and balance sheet data, use average values of the balance sheet item. 1. Dollar sales for each of the last 5 years 2. Percentage growth in sales year over year for each of the last 4 years 3. Earnings per share for each of the last 5 years. Note: as we did in lab use the Mergent "already calculated" EPS, which uses the net income attributable to Abercrombie & Finch (omits income attributable to noncontrolling interests). 4. Percentage change in EPS year over year for each the last 4 years 5. ROE and retention rate for the last 5 years. For equity, use the equity of Abercrombie and Fitch stockholders, not the total that includes equity of the noncontrolling interests. Retention rate is retained earnings for the period divided by net income or 100% minus the dividend payout percentage. If you have EPS and dividends per share the ratio DPS/EPS is the dividend payout ratio. Note that accumulated retained earnings on the balance is not retained earnings for the period. 6. For the most recent year compute and report: a. Current ratio b. Debt ratio c. Profit margin (ROS) d. Total Asset turnover e. Equity multiplier f. ROE g. Market to book h. Extended DuPont equation Reminder: When you calculate a ratio that combines income statement and balance sheet data, use average values of the balance sheet item. Hand in for each of the above items: A. Numbers showing work for items 1 through 6 as indicated above. B. One sentence of evaluation/observation for each item 1 through 5, plus a sentence for each part of 6. (You won't be able to say much about the ratios because you have only one data point and no industry comparison.) Report Date 05/04/2013 1012018 08/04/2018 2018 1020/2017 2 017 04/ 2017 10/ 2 010 2010 2010 10912015 0801/2015 02/2015 Currency 30 30 Und VAO Und 10 MOI VOI 30 m USO Unded Und United United Unkuded Und Unaved United United Und Uns Candidated Scale Cash & quants Recea Thousands Thousands Thousands Thousands Thousands Thousands Thousands Thousands Thousands Thousands Thousands Thousands Thousands 581.166 591 900 459.293 21.903 47.441 2002 87.714 1719 72.75 R 1100 12 12 10 132 454 13 05.107 570.484 4 S 5 51.146452175 45.63601541 478.618 441.00 Deferred income nel Other Our Total current sets Property & equipment, al cost Less accumulated depreciation & amortion Property Appment, net Operwinging Others 104,806 174, 2,799,142 2.000.835 0.007 8.08 177,24 2,810,471 20121 7330 72 215 1. 1045 1003,102 2812,6 2,766,67 20 1 500 34 N A 1.170 10211 2.105.44 197,45) W 006710 45 2,025.737 7.623 145.506 1213,150 2.630013 1911 7 1826 1,103,142 2.802.562 1.855.500 447 | 1,046,142 2,786.900 1.8379 4 | 71.803 So. 115.276 1.172,312 1.200.298 23,074 2,140,339 2.14442 2.602,253 2.100.053 2.120,015 2.110,320 4. 01.03 1202.240 114,719 244 25842 342200 2 00 200 140 10.041 3 713,187 240,050 3410 11.00 00 844 2.211.39 2.73 2.2970 3 7 2227 013 201 468 3.0 23 36.305 ,34412.512.144 372.006 2.422.301 2,15 2, 2 6,2 2.45 122.197 282.64 29.470 275 2 Accrued expenses Short term portion of personas Short-term portion of water come este Short portion of bo n gs 18.022 100 714505 0.166 1023 Longtemps 2507 Longmoon of bong Leasehold og 01 TTI 26 2.106.653 2.129 915 2110 200 200 KS 2,042 541 2015 10500 117450 97,623 .45.505 1911 09 17 684 527 103 79 DOT 7 930 3 314 305 DST BZ7.995 Property Operating Opera ornet senghituse 1.252,249 372.00 263 2,211,519 2.281,301 2.21.13 2.15705 2,336.468 3.422.36 180.041 2.263,089 266,33 293,410 15.542 2008 213.167 311,00 2,422 201 2364,592 H . 279.95 282,954 282.479 287 146 248.915 309209 Accounts payable Acred expenses Short-term portion of operang Shortcem portion of offered secrets 8.49 19.314 1.223 522 25 24 1.513 644 410 2017 52178 28.02 6.542 2017 Or 10237 PS KAN . 205,02 24,00 47,171 48,31 Long tom perio d er Long-term portion of operatings Long term portion of borrowing.net Leasehold francing on Others Totoong termes Common Class A common 2012 43 16.00 3.456 171M2 TO T7630 177,311 55.01 0.730 1,07 0 4 160 2 405.10 2. (109 ) 599 1.433 237.100 2 (1044) .800 .354 1,056 2 (104 ) 2 (101.44 06 135 3.754 4.61 24000 242 243 24858 (1825) 1032 1004) 15.37 1812 (120.00) 2.75 2.45 (106551) 4,754 2.713 2.473 1.695) 7.60 Undan son deren 105201) 0.66 ) 91.133 (109.349) (111,371) 1120280) (1 112) (1046) 104,149) (106230) (101787) (08.015) Acumulated other comprehensive income nel of Treasury average cost 1483224 1049 1522.714 1240 414 1,137310 4.375 111 1401363 1100.750 1482.757 1.157 1.430153 1 2 1510.378 1511 211.667 1225 151 286 5 44168 265.164 1495.2 1234 525 500,777 302 300 10 0 10579 3814 5 3714 10.124 104 1 1 170159 11 42 2014 29.02 n come Agapor Report Date Currency Auct Status Consolidated 05/04/2010 19012018 01/04/2018 1/2018 10/202017 07122017 04/20/2017 10/2/2010 10/2010 04.2018 7/2015 0401/2015 05/02/2015 Gute Quart Quw Quarter Qua QwQuin d e 10T SOI COI L VS3 CS3 9 10 10 10 90 United United United United Unaudited United United United United United United United Unaudited Yes YesYesYesYes Yes Thousands Thousands Thousand Thousands Thousands Thousands Thousands Thousands Thousands Theunde Thousands Thousands Thousands 732 861.1 0.414 730,- 5.112 61,099 1,734 10 685,43 78,572 817,756 708,422 3151519 255425 114 05 06 053 252 318. 75 3074 297 873 477,107 4.721 5. 5097 411 449 118 13 3915 119.846 07513 (1.518) 2015 3,819 1.00 1,139 1,900 Cost of we of option & amor Gross proto Stores & bon expense Marting general rative expense Restructuring charges (en ) Asset Impament Other person income pense net Operating income ) Interest expense Interest income Interest income expensele income foss) before taxes Income tax expense bent Net income oss Not income o t oncong 1,962 0.1977 154.311) 5613 14120 14.06) 1458 (2.605) 217) 612 11422 14.63) 1948) 31.590) 3.24 Netcome out Aber 10 se 519 Wege ge s tanding Weid average are standing and we ding 540 265 67153 13 2.18 12 6760 557 income per shared 09 35 01) 191) >


