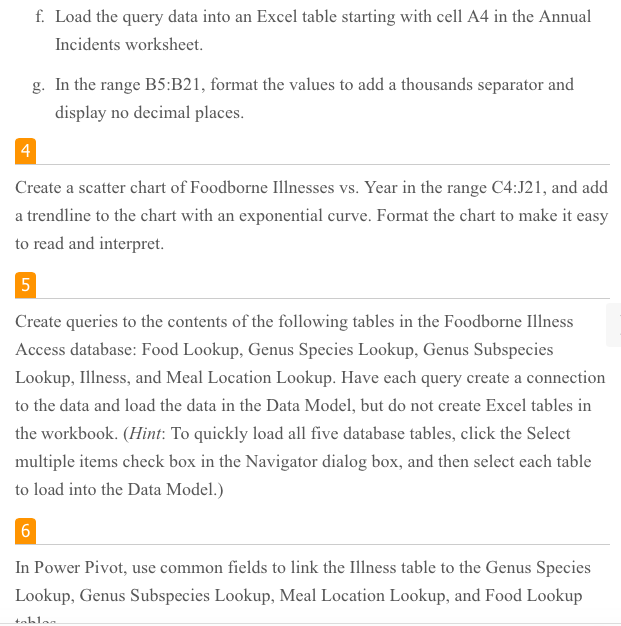
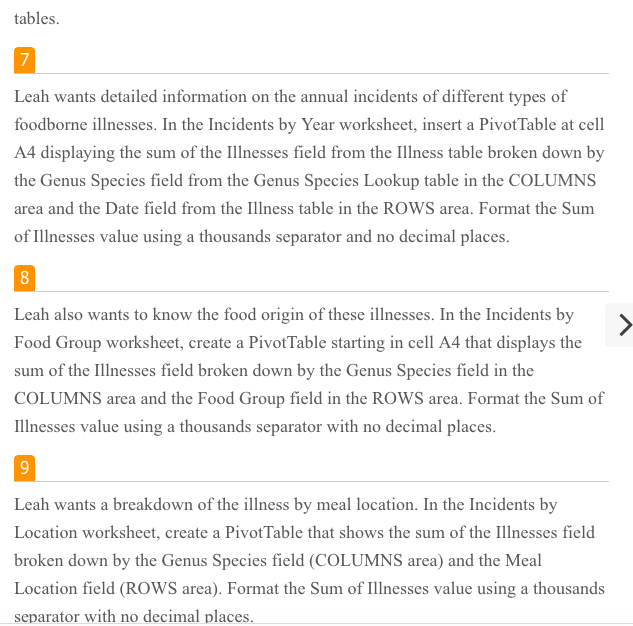
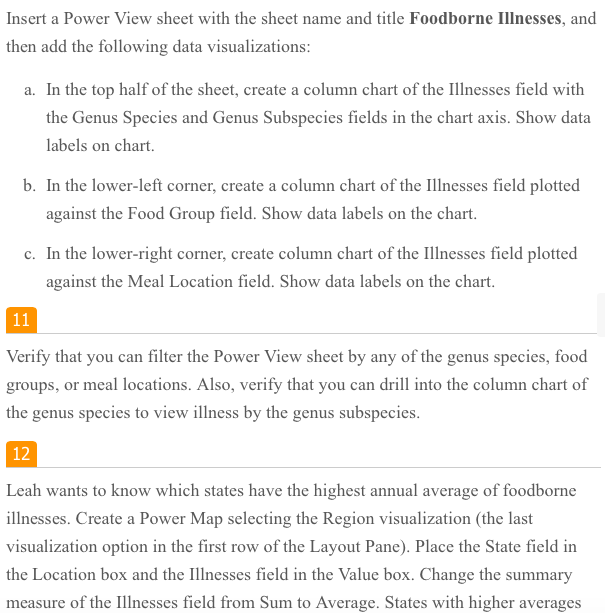
Sorry there are out of order. I am having a lot of trouble with this assignment. All information is provided. Please provide exact steps and equations to get to answers. Thank you.
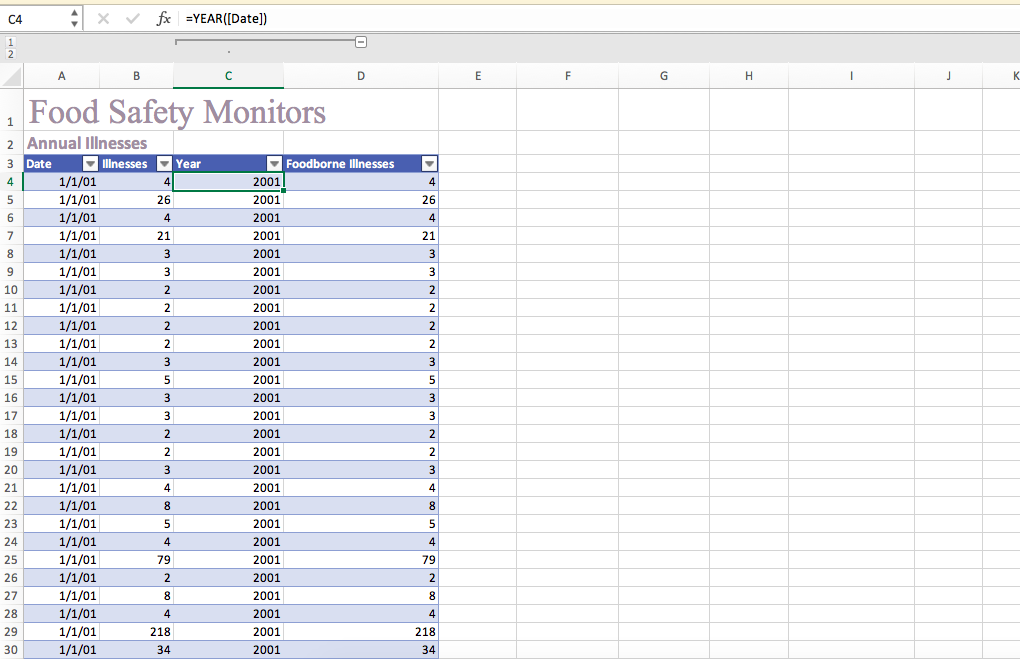
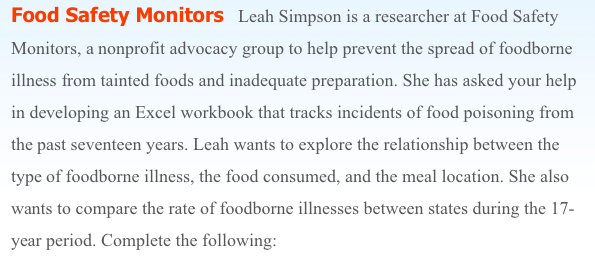
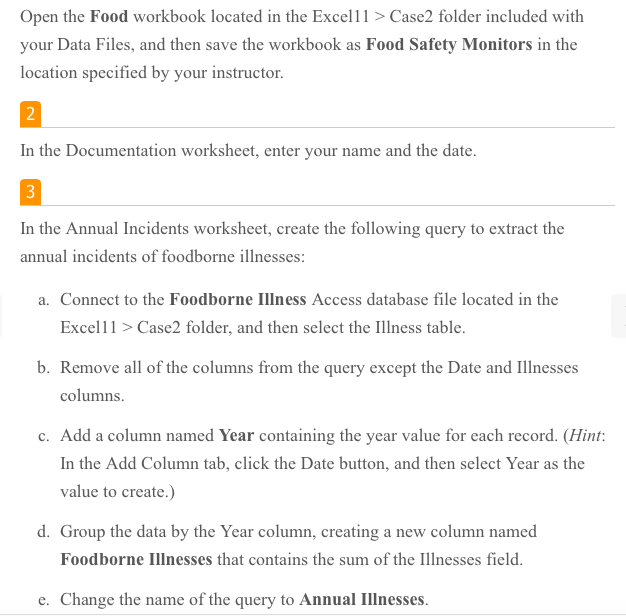
File Home Create External Data Database Tools Fields Table Tell me what you want to do.. K Cut 24 Ascending Ty Selection New _ Totals O ac Replace Calibri BE Copy to. Advanced - Save Spelling GO To + View Paste Filter Al Descending Refresh Find Format Painter 20 Remove Sort Toggle Filter All - X Delete . More Select BIUA Z M . = = =A. B. Views Clipboard Sort & Filter Records Find Text Formatting All Access Obje... > No Filter Search Datasheet View 9 x I hp BUS-LAB-351C4 X V fx =YEAR([Date]) C D E F G H I L A B Food Safety Monitors Annual Illnesses Foodborne Illnesses OWN Date Illnesses Year A 1/1/01 4 2001 1/1/01 26 2001 26 1/1/01 4 2001 4 1/1/01 21 2001 21 1/1/01 2001 1/1/01 2001 1/1/01 2001 11 1/1/01 2001 12 1/1/01 2001 13 1/1/01 2001 14 1/1/01 2001 15 1/1/01 2001 UnT OO D W N N W W O W N N N N W W 16 1/1/01 2001 A MOO A W N N W W O W N N N N W W 17 1/1/01 2001 18 1/1/01 2001 19 1/1/01 2001 20 1/1/01 2001 21 1/1/01 2001 22 1/1/01 2001 23 1/1/01 2001 24 1/1/01 2001 25 1/1/01 79 2001 79 26 1/1/01 2 2001 A CO N 27 1/1/01 2001 28 1/1/01 2001 29 1/1/01 218 2001 218 30 1/1/01 34 2001 34\f\f\fFood Safety Monitors Leah Simpson is a researcher at Food Safety Monitors, a nonprofit advocacy group to help prevent the spread of foodborne illness from tainted foods and inadequate preparation. She has asked your help in developing an Excel workbook that tracks incidents of food poisoning from the past seventeen years. Leah wants to explore the relationship between the type of foodborne illness, the food consumed, and the meal location. She also wants to compare the rate of foodborne illnesses between states during the 17- year period. Complete the following:Open the Food workbook located in the Excell1 > Case2 folder included with your Data Files, and then save the workbook as Food Safety Monitors in the location specified by your instructor. 2 In the Documentation worksheet, enter your name and the date. 3 In the Annual Incidents worksheet, create the following query to extract the annual incidents of foodborne illnesses: a. Connect to the Foodborne Illness Access database file located in the Excell1 > Case2 folder, and then select the Illness table. b. Remove all of the columns from the query except the Date and Illnesses columns. c. Add a column named Year containing the year value for each record. (Hint: In the Add Column tab, click the Date button, and then select Year as the value to create.) d. Group the data by the Year column, creating a new column named Foodborne Illnesses that contains the sum of the Illnesses field. e. Change the name of the query to Annual Illnesses.f. Load the query data into an Excel table starting with cell A4 in the Annual Incidents worksheet. g. In the range B5:B21, format the values to add a thousands separator and display no decimal places. 4 Create a scatter chart of Foodborne Illnesses vs. Year in the range C4:121, and add a trendline to the chart with an exponential curve. Format the chart to make it easy to read and interpret. 5 Create queries to the contents of the following tables in the Foodborne Illness Access database: Food Lookup, Genus Species Lookup, Genus Subspecies Lookup, Illness, and Meal Location Lookup. Have each query create a connection to the data and load the data in the Data Model, but do not create Excel tables in the workbook. (Hint: To quickly load all five database tables, click the Select multiple items check box in the Navigator dialog box, and then select each table to load into the Data Model.) 6 In Power Pivot, use common fields to link the Illness table to the Genus Species Lookup, Genus Subspecies Lookup, Meal Location Lookup, and Food Lookuptables. 7 Leah wants detailed information on the annual incidents of different types of foodborne illnesses. In the Incidents by Year worksheet, insert a PivotTable at cell A4 displaying the sum of the Illnesses field from the Illness table broken down by the Genus Species field from the Genus Species Lookup table in the COLUMNS area and the Date field from the Illness table in the ROWS area. Format the Sum of Illnesses value using a thousands separator and no decimal places. 8 Leah also wants to know the food origin of these illnesses. In the Incidents by Food Group worksheet, create a PivotTable starting in cell A4 that displays the sum of the Illnesses field broken down by the Genus Species field in the COLUMNS area and the Food Group field in the ROWS area. Format the Sum of Illnesses value using a thousands separator with no decimal places. 9 Leah wants a breakdown of the illness by meal location. In the Incidents by Location worksheet, create a PivotTable that shows the sum of the Illnesses field broken down by the Genus Species field (COLUMNS area) and the Meal Location field (ROWS area). Format the Sum of Illnesses value using a thousands separator with no decimal places.Insert a Power View sheet with the sheet name and title Foodborne Illnesses, and then add the following data visualizations: a. In the top half of the sheet, create a column chart of the Illnesses field with the Genus Species and Genus Subspecies fields in the chart axis. Show data labels on chart. b. In the lower-left corner, create a column chart of the Illnesses field plotted against the Food Group field. Show data labels on the chart. c. In the lower-right corner, create column chart of the Illnesses field plotted against the Meal Location field. Show data labels on the chart. 11 Verify that you can filter the Power View sheet by any of the genus species, food groups, or meal locations. Also, verify that you can drill into the column chart of the genus species to view illness by the genus subspecies. 12 Leah wants to know which states have the highest annual average of foodborne illnesses. Create a Power Map selecting the Region visualization (the last visualization option in the first row of the Layout Pane). Place the State field in the Location box and the Illnesses field in the Value box. Change the summary measure of the Illnesses field from Sum to Average. States with higher averagesof foodborne illness will appear in a dark shade on the map. 13 Save the workbook, and then close it
