Answered step by step
Verified Expert Solution
Question
1 Approved Answer
Spence Resources Inc.'s December 31 incomplete balance sheet information follows along with additional information 2016 $362,220 $212,000 139,200 262,170 176,966 138,410 73,170 99,084 103,690 468,000
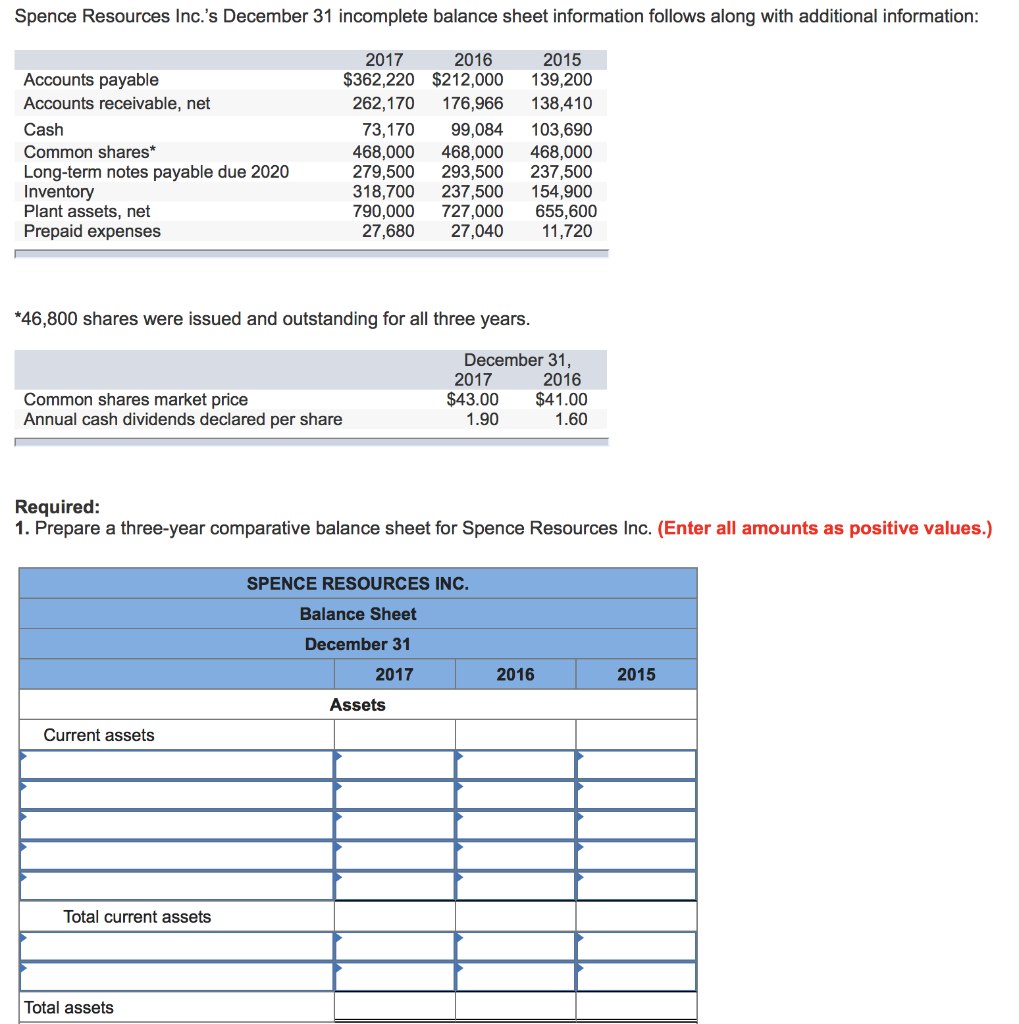
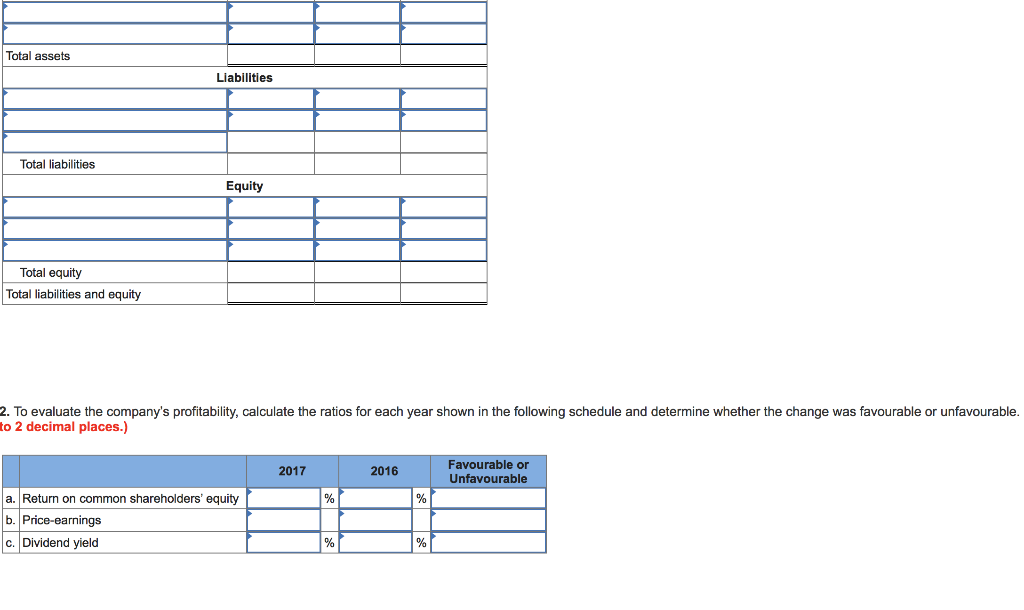
Spence Resources Inc.'s December 31 incomplete balance sheet information follows along with additional information 2016 $362,220 $212,000 139,200 262,170 176,966 138,410 73,170 99,084 103,690 468,000 468,000 468,000 279,500 293,500 237,500 318,700 237,500 154,900 790,000 727,000 655,600 27,680 27,040 11,720 2017 2015 Accounts payable Accounts receivable, net Cash Common shares* Long-term notes payable due 2020 Inventory Plant assets, net Prepaid expenses 46,800 shares were issued and outstanding for all three years December 31, 2016 $43.00 $41.00 1.60 2017 Common shares market price Annual cash dividends declared per share 1.90 Required: 1. Prepare a three-year comparative balance sheet for Spence Resources Inc. (Enter all amounts as positive values.) SPENCE RESOURCES INC. Balance Sheet December 31 2017 2016 2015 Assets Current assets Total current assets Total assets Total assets Liabilities Total liabilities Equity Total equity Total liabilities and equity 2. To evaluate the company's profitability, calculate the ratios for each year shown in the following schedule and determine whether the change was favourable or unfavourable to 2 decimal places.) Favourable or Unfavourable 2017 2016 a. Return on common shareholders' equity b. Price-earnings c. Dividend yield
Step by Step Solution
There are 3 Steps involved in it
Step: 1
Get Instant Access to Expert-Tailored Solutions
See step-by-step solutions with expert insights and AI powered tools for academic success
Step: 2
Step: 3
Ace Your Homework with AI
Get the answers you need in no time with our AI-driven, step-by-step assistance
Get Started