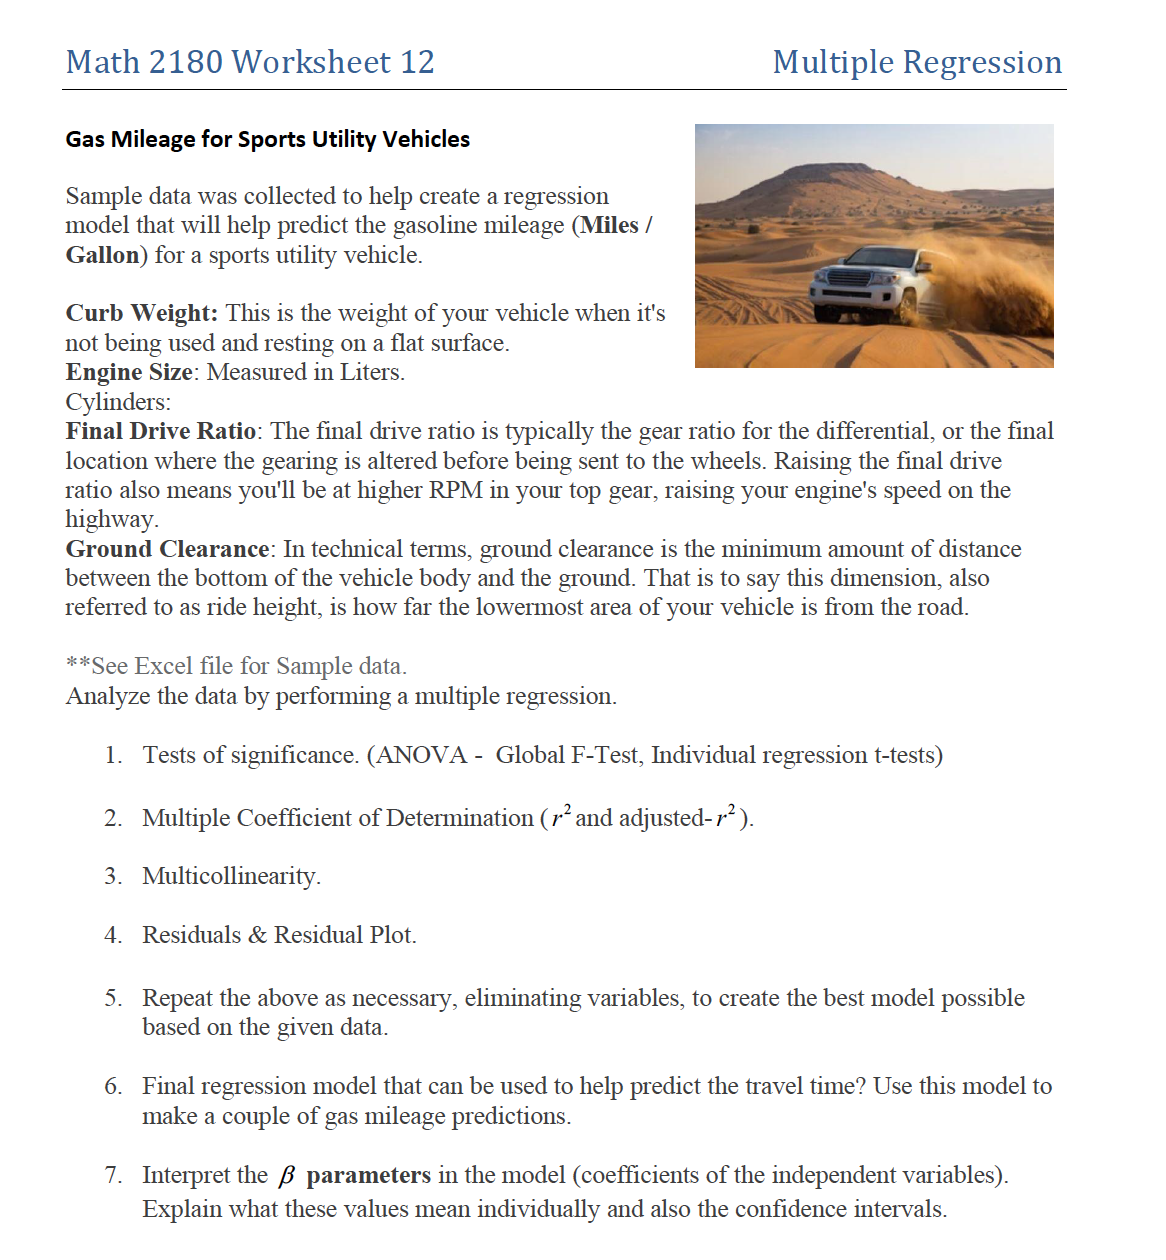
Sport Utility Vehicle Curb Weight (Ibs) Engine Size (liters) Cylinders Final Drive Ratio (x:1) Ground Clearance Miles/gallon Mercedes G500 5510 5 8 4.38 8.3 13 Jeep Wrangler X 3760 3.8 6 3.21 8.8 16 Mitsunishi Endeavor LS 2WD 3902 3.8 6 4.01 8.3 18 Toyota Land Cruiser 5690 5.7 8 3.91 8.9 15 Kia Sorento 4X2 4068 3.3 6 3.33 8.2 18 Jeep Commander Sport 4X2 4649 4.7 8 3.73 8.6 15 Dodge Durango SLT 4X2 4709 4.7 8 3.55 8.7 15 Lincoln Navigator 4X2 5555 5.4 8 3.73 9.2 15 Chevrolet Tahoe LS 2WD 5265 4.8 3.23 3.1 16 Ford Escape FWD 3387 3 2.93 8.5 20 Ford Expedition XLT 5578 5.4 3.31 8.7 14 Buick Enclave CX FWD 4780 3.6 3.16 8.4 19 Cadillac Escalade 2WD 5459 6.2 8 3.42 6 14 Hummer H3 SUV 4689 3.7 5 4.56 9.1 15 Saab 9-7X 4720 4.2 on 3.73 7.7 16Math 2180 Worksheet 12 Multiple Regression Gas Mileage for Sports Utility Vehicles Sample data was collected to help create a regression model that will help predict the gasoline mileage (Miles / Gallon) for a sports utility vehicle. Curb Weight: This is the weight of your vehicle when it's not being used and resting on a flat surface. Engine Size: Measured in Liters. Cylinders: Final Drive Ratio: The final drive ratio is typically the gear ratio for the differential, or the final location where the gearing is altered before being sent to the wheels. Raising the final drive ratio also means you'll be at higher RPM in your top gear, raising your engine's speed on the highway. Ground Clearance: In technical terms, ground clearance is the minimum amount of distance between the bottom of the vehicle body and the ground. That is to say this dimension, also referred to as ride height, is how far the lowermost area of your vehicle is from the road. * *See Excel file for Sample data. Analyze the data by performing a multiple regression. 1. Tests of significance. (ANOVA - Global F-Test, Individual regression t-tests) 2. Multiple Coefficient of Determination ( 72 and adjusted-72 ). 3. Multicollinearity. 4. Residuals & Residual Plot. 5. Repeat the above as necessary, eliminating variables, to create the best model possible based on the given data. 6. Final regression model that can be used to help predict the travel time? Use this model to make a couple of gas mileage predictions. 7. Interpret the B parameters in the model (coefficients of the independent variables). Explain what these values mean individually and also the confidence intervals


