st
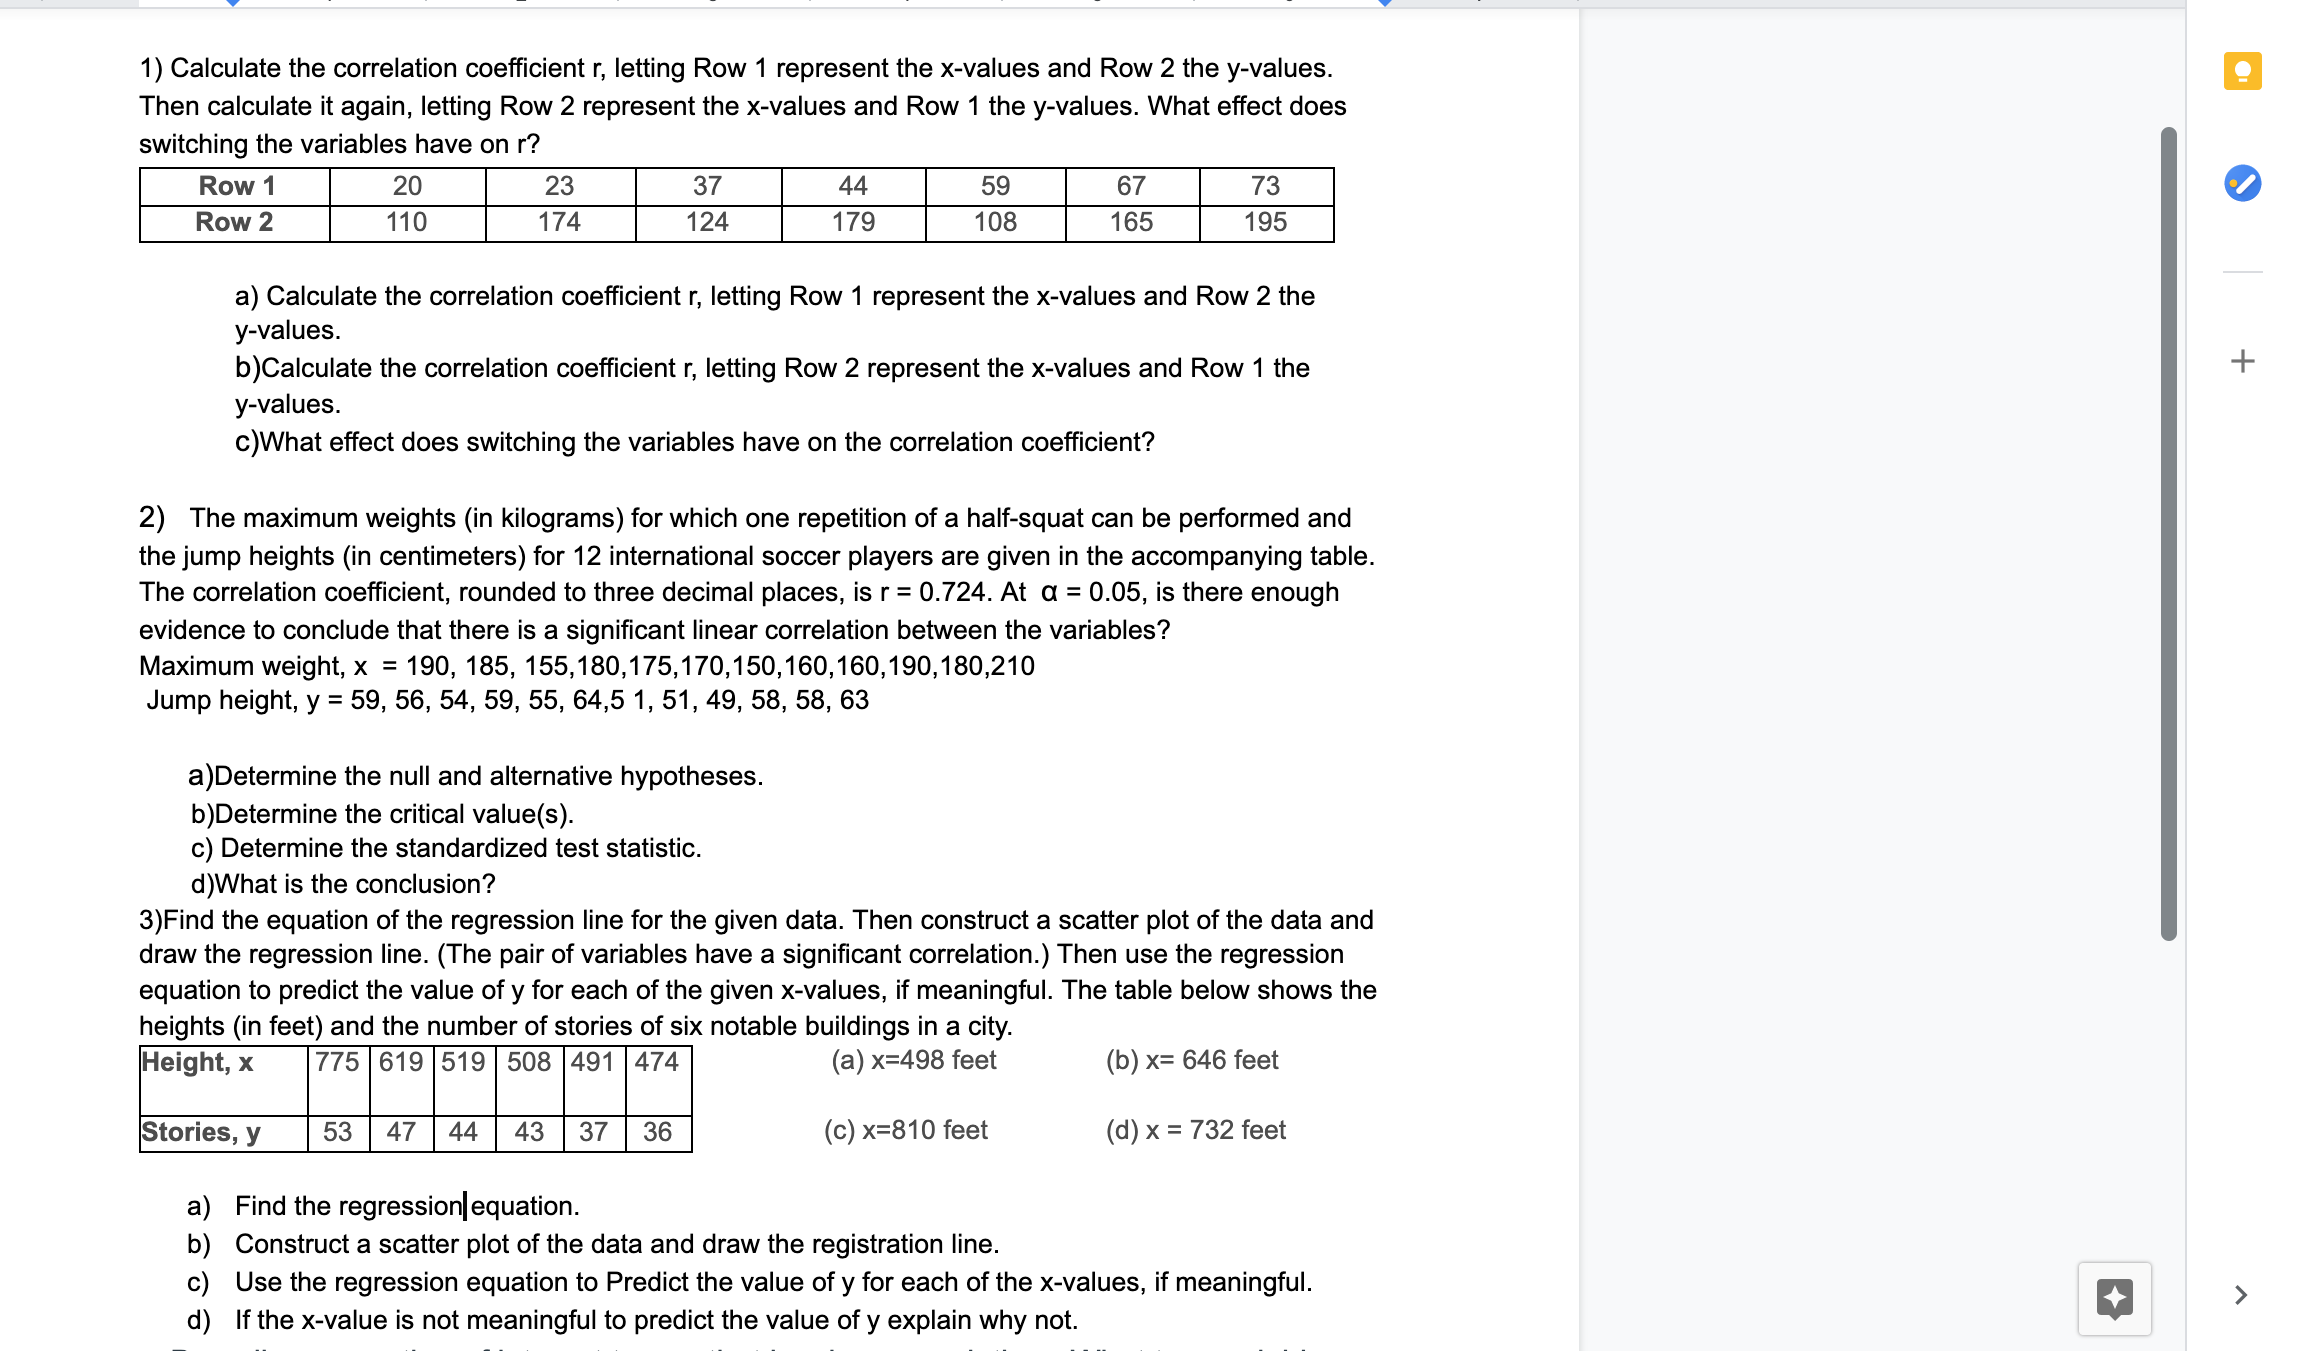
1) Calculate the correlation coefficient r, letting Row 1 represent the x-values and Row 2 the y-values. Then calculate it again, letting Row 2 represent the x-values and Row 1 the y-values. What effect does switching the variables have on r? Row 1 20 23 37 44 59 67 73 Row 2 110 174 124 179 108 165 195 a) Calculate the correlation coefficient r, letting Row 1 represent the x-values and Row 2 the y-values b)Calculate the correlation coefficient r, letting Row 2 represent the x-values and Row 1 the + y-values. c)What effect does switching the variables have on the correlation coefficient? 2) The maximum weights (in kilograms) for which one repetition of a half-squat can be performed and the jump heights (in centimeters) for 12 international soccer players are given in the accompanying table. The correlation coefficient, rounded to three decimal places, is r = 0.724. At a = 0.05, is there enough evidence to conclude that there is a significant linear correlation between the variables? Maximum weight, x = 190, 185, 155, 180, 175, 170, 150, 160, 160, 190, 180,210 Jump height, y = 59, 56, 54, 59, 55, 64,5 1, 51, 49, 58, 58, 63 a)Determine the null and alternative hypotheses. b)Determine the critical value(s) c) Determine the standardized test statistic. d)What is the conclusion? 3)Find the equation of the regression line for the given data. Then construct a scatter plot of the data and draw the regression line. (The pair of variables have a significant correlation.) Then use the regression equation to predict the value of y for each of the given x-values, if meaningful. The table below shows the heights (in feet) and the number of stories of six notable buildings in a city. Height, x 775 619 519 508 491 474 (a) x=498 feet (b) x= 646 feet Stories, y 53 47 44 43 37 36 (c) x=810 feet (d) x = 732 feet a) Find the regression equation. b) Construct a scatter plot of the data and draw the registration line. c) Use the regression equation to Predict the value of y for each of the x-values, if meaningful. + d) If the x-value is not meaningful to predict the value of y explain why not.4) Describe a question of interest to you that involves correlation. What two variables are you interested in to see if there is a correlation


