Answered step by step
Verified Expert Solution
Question
1 Approved Answer
STA 100, Winter 2022 - Quiz #1 Please answer the following questions as completely as possible. Be sure to show ALL WORK. Partial credit will
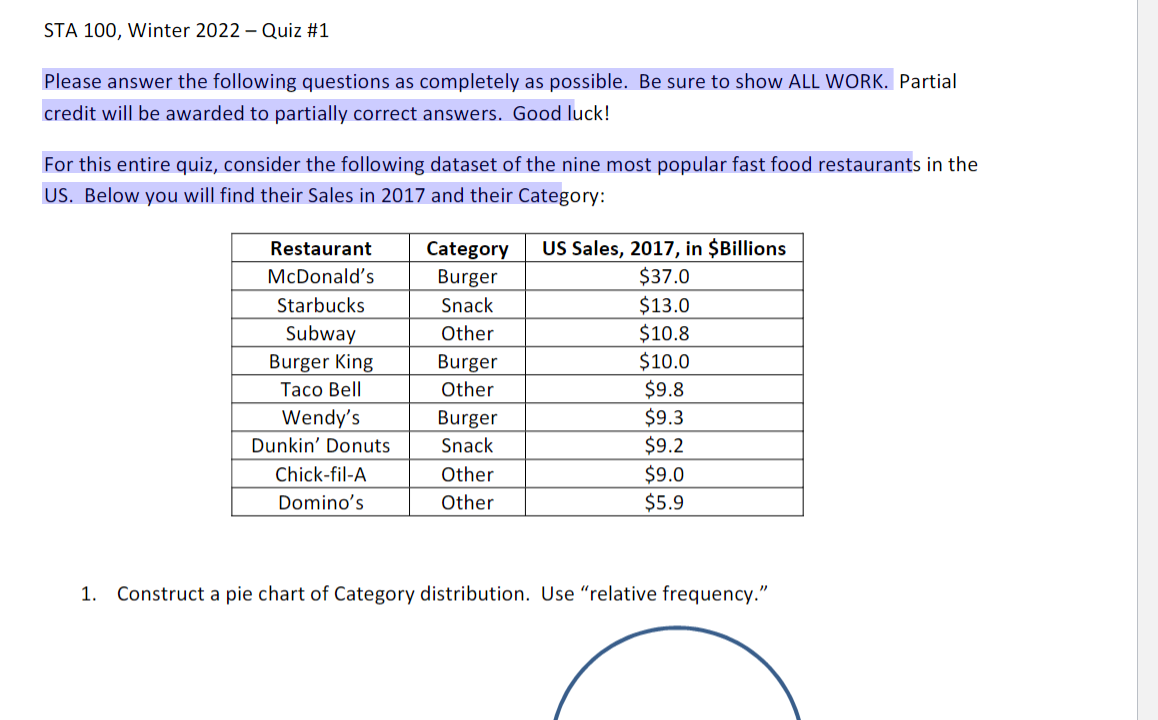
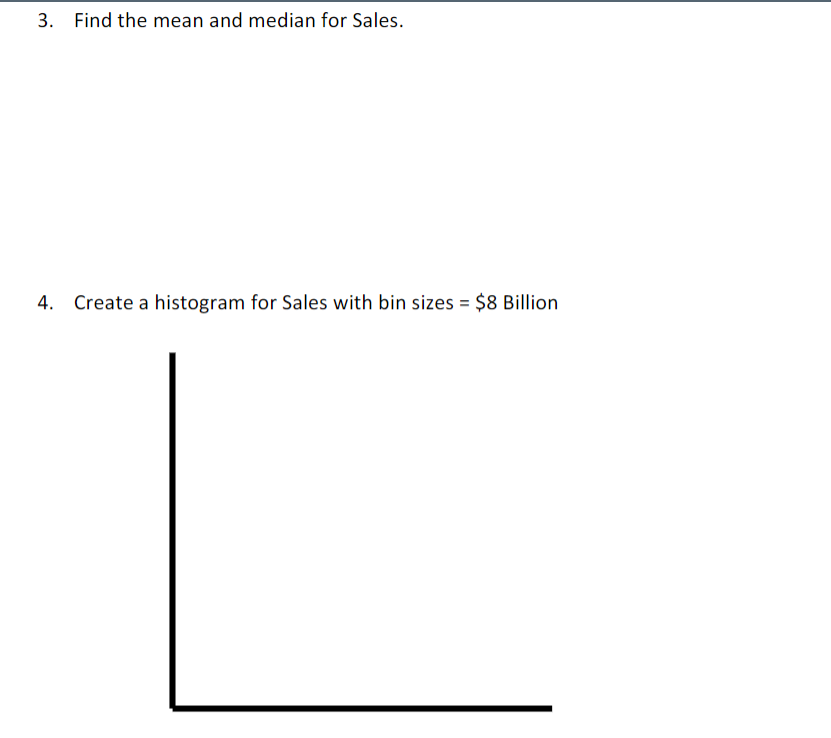
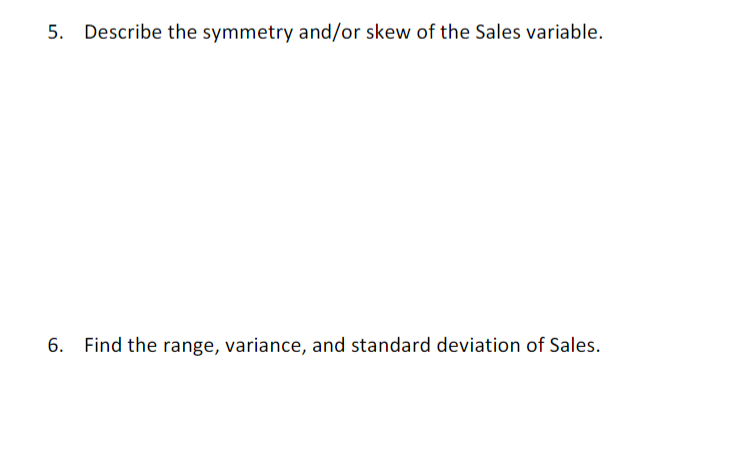
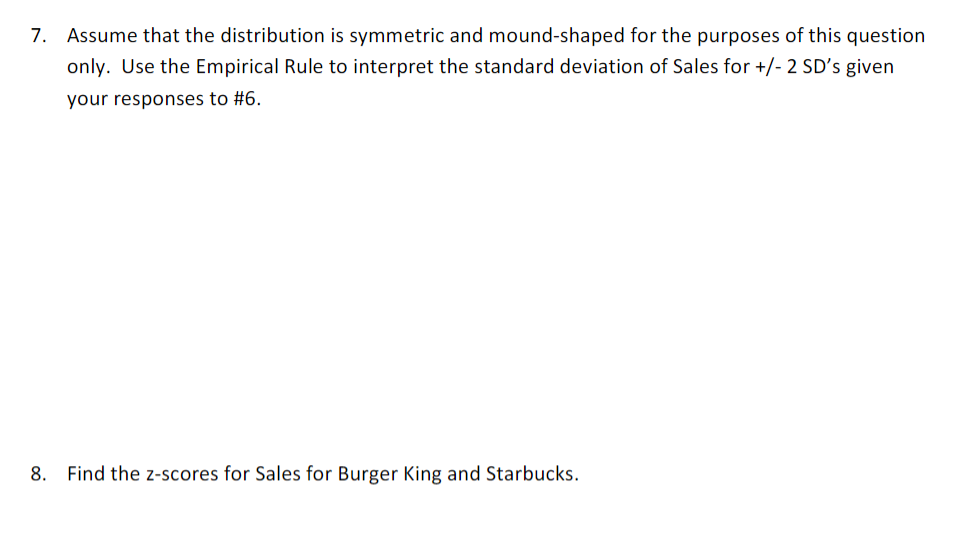
STA 100, Winter 2022 - Quiz #1 Please answer the following questions as completely as possible. Be sure to show ALL WORK. Partial credit will be awarded to partially correct answers. Good luck! For this entire quiz, consider the following dataset of the nine most popular fast food restaurants in the US. Below you will find their Sales in 2017 and their Category: Restaurant Category US Sales, 2017, in $Billions Mcdonald's Burger $37.0 Starbucks Snack $13.0 Subway Other $10.8 Burger King Burger $10.0 Taco Bell Other $9.8 Wendy's Burger $9.3 Dunkin' Donuts Snack $9.2 Chick-fil-a Other $9.0 Domino's Other $5.9 1. Construct a pie chart of Category distribution. Use "relative frequency."\f3. Find the mean and median for Sales. 4. Create a histogram for Sales with bin sizes = $8 Billion 5. Describe the symmetry and/or skew of the Sales variable. 6. Find the range, variance, and standard deviation of Sales. 7. Assume that the distribution is symmetric and mound-shaped for the purposes of this question only. Use the Empirical Rule to interpret the standard deviation of Sales for +/- 2 SD's given your responses to #5. 8. Find the z-scores for Sales for Burger King and Starbucks. \f
Step by Step Solution
There are 3 Steps involved in it
Step: 1
Get Instant Access to Expert-Tailored Solutions
See step-by-step solutions with expert insights and AI powered tools for academic success
Step: 2
Step: 3
Ace Your Homework with AI
Get the answers you need in no time with our AI-driven, step-by-step assistance
Get Started