

Answered step by step
Verified Expert Solution
Question
1 Approved Answer
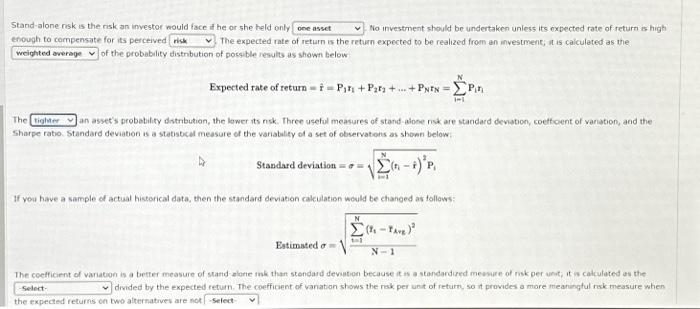
Stand-alone risk is the risk an investor would face if he or she held only one asset No investment should be undertaken unless its expected
Stand-alone risk is the risk an investor would face if he or she held only one asset No investment should be undertaken unless its expected rate of return is high enough to compensate for its perceived risk The expected rate of return is the return expected to be realized from an investment, it is calculated as the weighted average of the probability distribution of possible results as shown below Expected rate of return = f = Pr + Pr2+...+PNIN = = Pin The tighter V an asset's probability distribution, the lower its risk. Three useful measures of stand-alone risk are standard deviation, coefficient of variation, and the Sharpe ratio. Standard deviation is a statistical measure of the variability of a set of observations as shown below: Standard deviation == -Select- N (-1) 'P -) i=1 If you have a sample of actual historical data, then the standard deviation calculation would be changed as follows: Estimated = N i=1 N (ft FAvg.) - t-1 N-1 The coefficient of variation is a better measure of stand-alone risk than standard deviation because it is a standardized measure of risk per unit, it is calculated as the divided by the expected return. The coefficient of variation shows the risk per unit of return, so it provides a more meaningful risk measure when the expected returns on two alternatives are not -Select-
Step by Step Solution
There are 3 Steps involved in it
Step: 1

Get Instant Access to Expert-Tailored Solutions
See step-by-step solutions with expert insights and AI powered tools for academic success
Step: 2

Step: 3
Ace Your Homework with AI
Get the answers you need in no time with our AI-driven, step-by-step assistance
Get Started
The Preppers Financial Guide
Authors: Jim Cobb
1st Edition
1612434037, 978-1612434032