

Question: STAT 1400 Lab 6 SU: Assessing Normality with TI Calculator Name: Six data sets are presented, some of them are samples from a normal distribution,
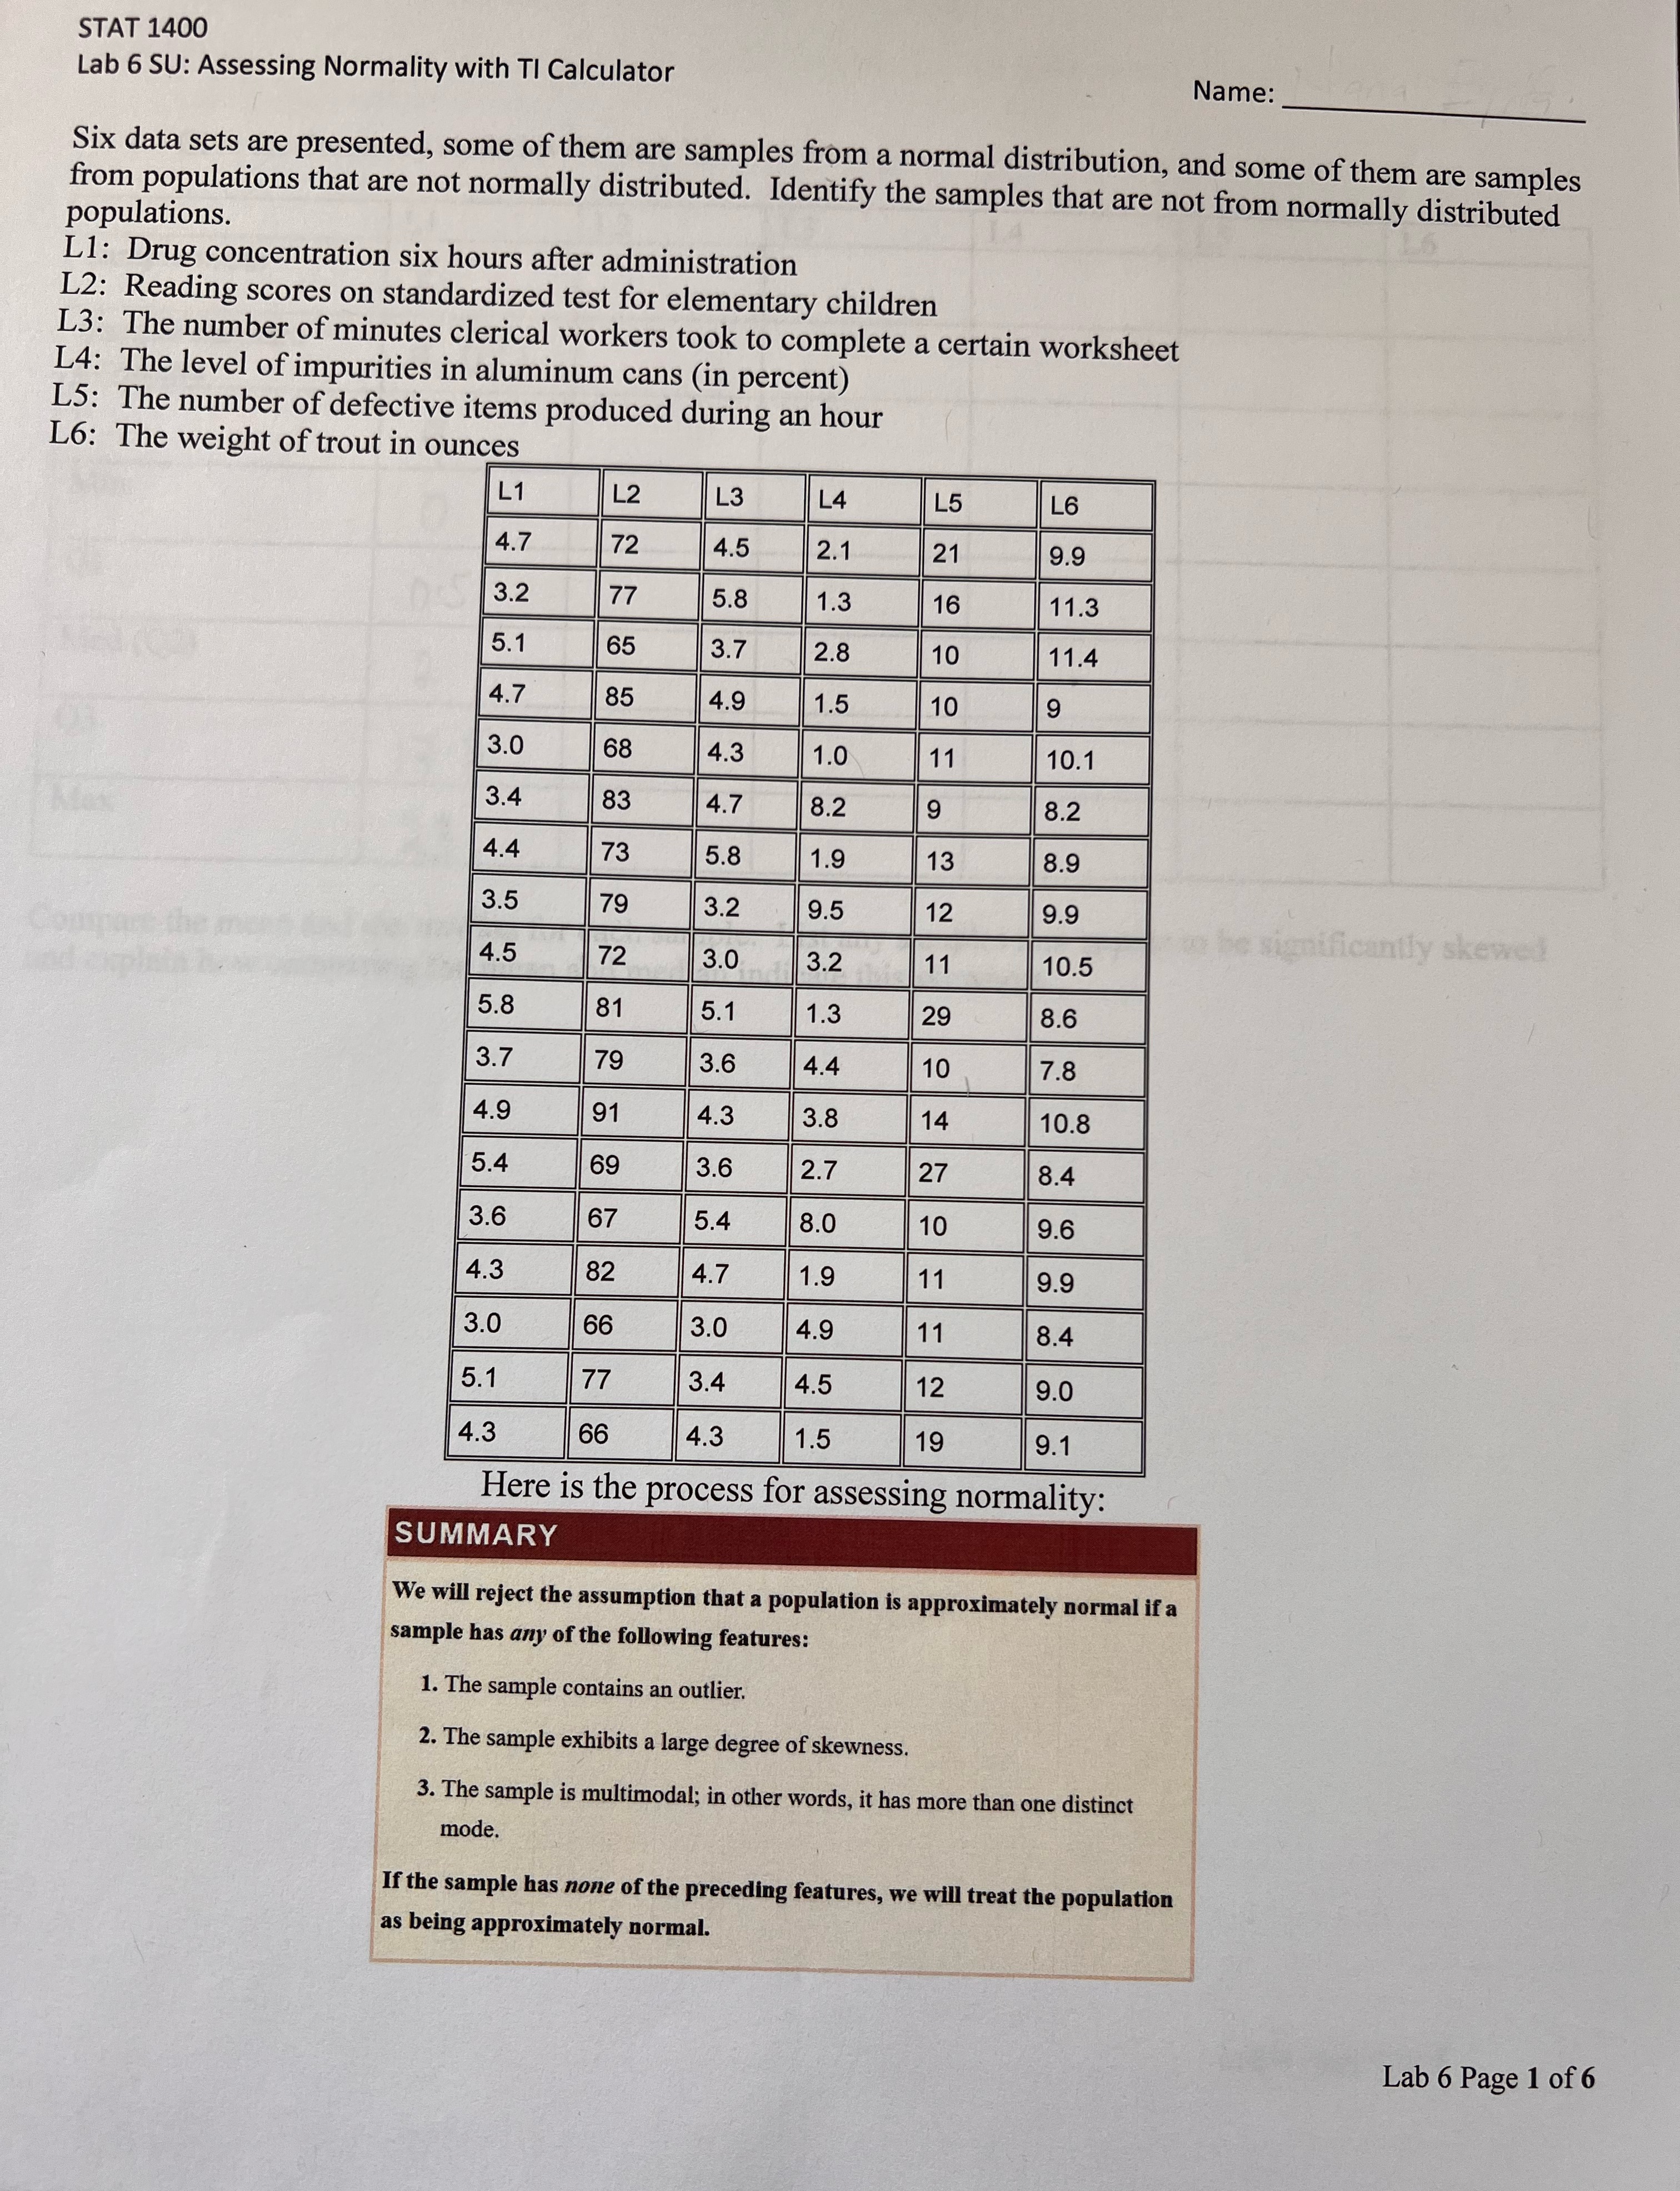
STAT 1400 Lab 6 SU: Assessing Normality with TI Calculator Name: Six data sets are presented, some of them are samples from a normal distribution, and some of them are samples from populations that are not normally distributed. Identify the samples that are not from normally distributed populations. L1: Drug concentration six hours after administration L2: Reading scores on standardized test for elementary children L3: The number of minutes clerical workers took to complete a certain worksheet L4: The level of impurities in aluminum cans (in percent L5: The number of defective items produced during an hour L6: The weight of trout in ounces L1 L2 L3 L4 L5 L6 4.7 72 4.5 2.1 21 9.9 3.2 77 5.8 1.3 16 11.3 5.1 65 3.7 2.8 10 11.4 4.7 85 4.9 1.5 10 3.0 68 4.3 1.0 11 10.1 3.4 83 4.7 8.2 9 8.2 4.4 73 5.8 1.9 13 8.9 3.5 79 3.2 9.5 12 9.9 4.5 the significantly skewel 72 3.0 3.2 11 10.5 5.8 81 5.1 1.3 29 8.6 3.7 79 3.6 4.4 10 7.8 4.9 91 4.3 3.8 14 10.8 5.4 69 3.6 2.7 27 8.4 3.6 67 5.4 8.0 10 9.6 4.3 82 4.7 1.9 11 9.9 3.0 66 3.0 4.9 11 8.4 5 .1 77 3.4 4.5 12 9.0 4.3 66 4.3 1.5 19 9.1 Here is the process for assessing normality: SUMMARY We will reject the assumption that a population is approximately normal if a sample has any of the following features: 1. The sample contains an outlier. 2. The sample exhibits a large degree of skewness. 3. The sample is multimodal; in other words, it has more than one distinct mode If the sample has none of the preceding features, we will treat the population as being approximately normal. Lab 6 Page 1 of 6
Step by Step Solution
There are 3 Steps involved in it

Get step-by-step solutions from verified subject matter experts