

Question
Statement on Auditing Standards No. 99 requires the audit engagement team to hold a brainstorming session in planning each audit engagement to identify areas of
Statement on Auditing Standards No. 99 requires the audit engagement team to hold a brainstorming session in planning each audit engagement to identify areas of potential material misstatement due to fraud. In addition, auditing standards require analytical procedures in the planning stage of the audit to assist in planning the nature, timing, and extent of auditing procedures that will be performed.
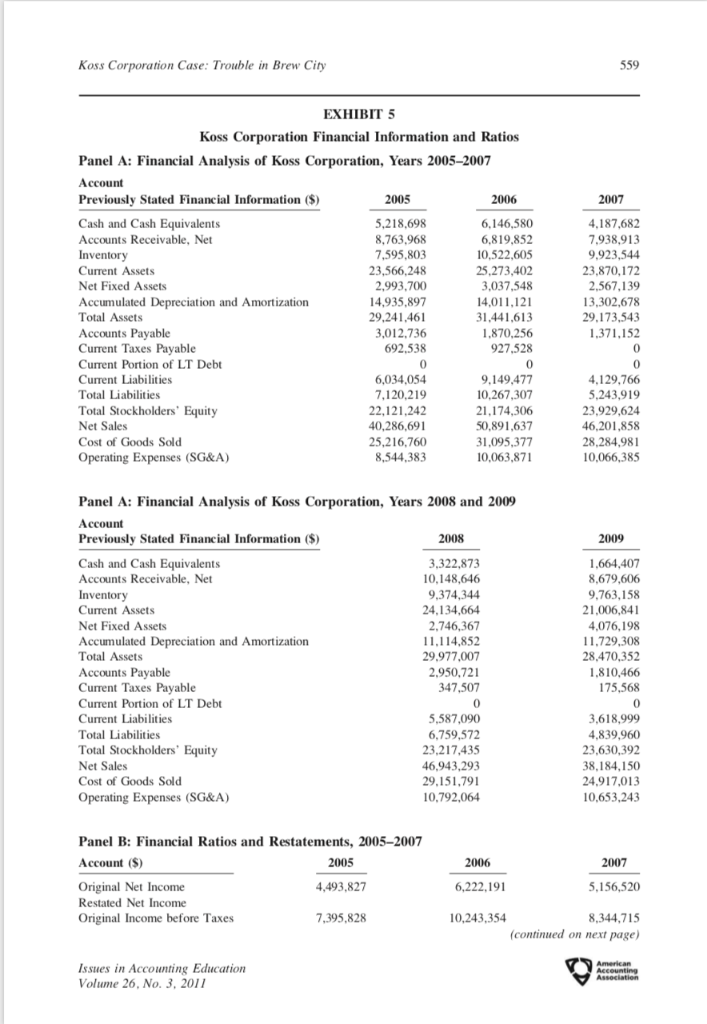
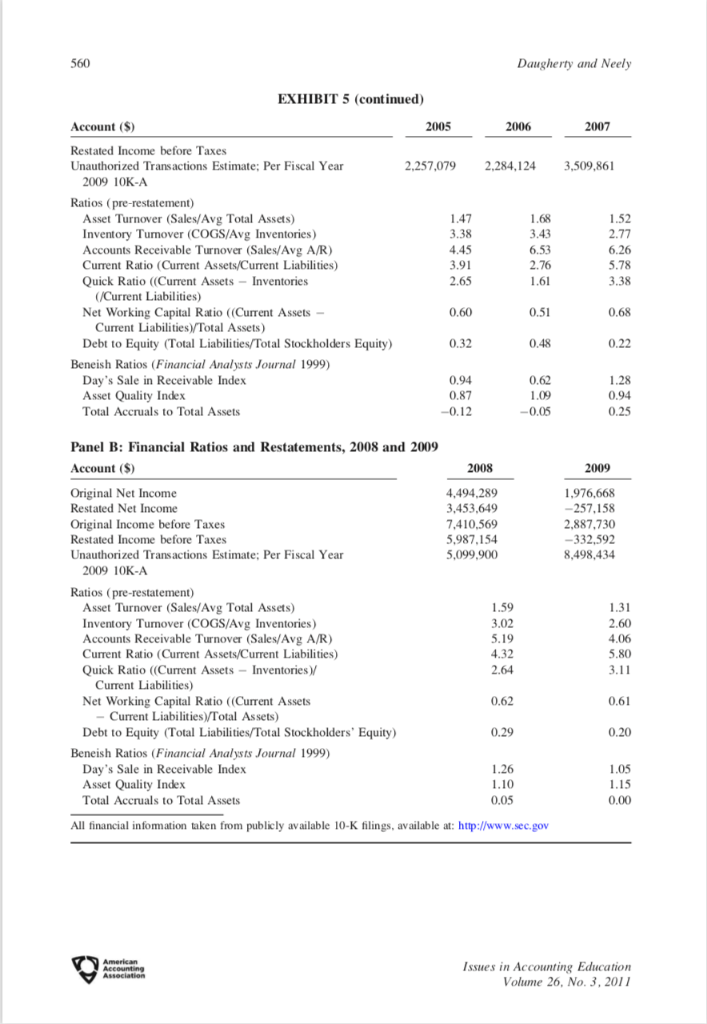
Suppose you have been assigned the task of applying analytical procedures designed to detect Koss Corporation accounts that may be susceptible to material misstatement. Based on your review of Koss financial information, which financial ratios, trends, etc., do you believe indicate potential risk indicators for Koss financial statements being materially misstated? Support your conclusion with specific, quantifiable numbers.
Koss Corporation Case: Trouble in Brew City 559 EXHIBIT 5 Koss Corporation Financial Information and Ratios Panel A: Financial Analysis of Koss Corporation, Years 2005-2007 Accoun Previously Stated Financial Information () 2006 2007 Cash and Cash Equivalents Accounts Receivable, Net Inventory Current Assets Net Fixed Assets Accumulated Depreciation and Amortization Total Assets Accounts Payable Current Taxes Payable Current Portion of LT Debt Current Liabilities Total Liabilities Total Stockholders' Equity 5,218,698 8,763.968 7,595.803 23,566.248 2,993,700 4,935,897 6,146,580 6,819,852 10,522.605 25,273.402 3,037,548 4,011,121 1,441,613 1,870,256 927,528 0 4.187,682 7,938,913 9.923,544 23,870,172 2,567,139 13,302,678 29,173,543 1,371,152 0 0 4.129,766 29,241,46 ,012,736 692.538 0 6,034,054 7,120,219 9,149,477 10,267,307 21,174,306 0,891,637 1,095,377 10,063,871 243 23,929,624 46,201,858 28,284,981 10,066,385 22,121,242 Cost of Goods Sold Operating Expenses (SG&A) 40,286,691 25,216,760 8,544.383 Panel A: Financial Analysis of Koss Corporation, Years 2008 and 2009 Account Previously Stated Financial Information () 2008 2009 Cash and Cash Equivalents Accounts Receivable, Net Inventory Current Net Fixed Assets Accumulated Depreciation and Amortization Total Assets 3.322,873 10.148,646 9,374,344 24.134,664 2,746,367 11,114,852 29,977,007 2.950.721 347,507 0 5,587,090 6,759,572 23,217,435 46,943,293 29,151,791 10,792,064 1,664.407 8,679,606 9.763,158 21,006,841 4,076,198 11,729,308 28.470,352 1,810.466 175,568 0 3,618,999 4,839,960 23,630,392 Current Taxes Payable Current Portion of LT Debt Current Liabilities Total Liabilities Total Stockholders' Equity Cost of Goods Sold Operating Expenses (SG&A) 24.917,013 10,653,243 Panel B: Financial Ratios and Restatements, 2005-2007 2005 4493,827 7,395,828 Account (S) 5,156,520 Original Net Income Restated Net Income Original Income before Taxes 10,243,354 8,344,715 (continued on next page Issues in Accounting Education Volume 26, No. 3, 2011 560 Daugherty and Neely EXHIBIT 5 (continued) Account (S) Restated Income before Taxes Unauthorized Transactions Estimate: Per Fiscal Year 2005 2006 2007 2,257,079 2,284,1243,509,861 2009 10K-A Ratios (pre-restatement) Asset Turnover (Sales/Avg Total Assets) Inventory Tuover (COGS/Avg Inventories) Accounts Receivable Turnover (Sales/Avg A/R) Current Ratio (Current Assets/Current Liabilities) Quick Ratio ((Current Assets Inventories 1.52 2.77 6.26 5.78 3.38 3.38 4.45 2.65 0.60 3.43 6.53 2.76 1.61 /Current Liabilities) Net Working Capital Ratio ((Current Assets- 0.51 0.68 Current Liabilities) Total Assets) Debt to Equity (Total Liabilities/Total Stockholders Equity) Beneish Ratios (Financial Analysts Journal 1999) 0.32 0.48 0.22 Day's Sale in Receivable Index 0.62 1.28 0.94 0.25 0.94 Asset Quality Index Total Accruals to Total Assets 0.12 Panel B: Financial Ratios and Restatements, 2008 and 2009 Account (S) 2008 2009 Original Net Income Restated Net Income Original Income before Taxes Restated Income before Taxes Unauthorized Transactions Estimate: Per Fiscal Year 4,494.289 3,453,649 7,410,569 5,987.154 5,099,900 1,976,668 -257,158 2,887.730 -332,592 8.498.434 2009 10K-A Ratios (pre-restatement) Asset Turnover (Sales/Avg Total Assets) Inventory Turnover (COGS/Avg Inventories) Accounts Receivable Turnover (Sales/Avg A/R) Current Ratio (Current Assets/Current Liabilities) Quick Ratio ((Current Assets-Inventories) 1.59 1.31 2.60 4.06 3.02 4.32 2.64 0.62 0.29 Current Liabilities) Net Working Capital Ratio (Current Assets 0.61 Current LiabilitiesTotal Assets) Debt to Equity (Total Liabilities/Total Stockholders' Equity) 0.20 Beneish Ratios (Financial Analysts Journal 1999) Day's Sale in Receivable Index Asset Quality Index Total Accruals to Total Assets 1.26 1.05 0.05 0.00 All financial infomation taken from publicly available 10-K filings, available at: http://www.sec.gov Issues in Accounting Education Volume 26, No. 3,201 Koss Corporation Case: Trouble in Brew City 559 EXHIBIT 5 Koss Corporation Financial Information and Ratios Panel A: Financial Analysis of Koss Corporation, Years 2005-2007 Accoun Previously Stated Financial Information () 2006 2007 Cash and Cash Equivalents Accounts Receivable, Net Inventory Current Assets Net Fixed Assets Accumulated Depreciation and Amortization Total Assets Accounts Payable Current Taxes Payable Current Portion of LT Debt Current Liabilities Total Liabilities Total Stockholders' Equity 5,218,698 8,763.968 7,595.803 23,566.248 2,993,700 4,935,897 6,146,580 6,819,852 10,522.605 25,273.402 3,037,548 4,011,121 1,441,613 1,870,256 927,528 0 4.187,682 7,938,913 9.923,544 23,870,172 2,567,139 13,302,678 29,173,543 1,371,152 0 0 4.129,766 29,241,46 ,012,736 692.538 0 6,034,054 7,120,219 9,149,477 10,267,307 21,174,306 0,891,637 1,095,377 10,063,871 243 23,929,624 46,201,858 28,284,981 10,066,385 22,121,242 Cost of Goods Sold Operating Expenses (SG&A) 40,286,691 25,216,760 8,544.383 Panel A: Financial Analysis of Koss Corporation, Years 2008 and 2009 Account Previously Stated Financial Information () 2008 2009 Cash and Cash Equivalents Accounts Receivable, Net Inventory Current Net Fixed Assets Accumulated Depreciation and Amortization Total Assets 3.322,873 10.148,646 9,374,344 24.134,664 2,746,367 11,114,852 29,977,007 2.950.721 347,507 0 5,587,090 6,759,572 23,217,435 46,943,293 29,151,791 10,792,064 1,664.407 8,679,606 9.763,158 21,006,841 4,076,198 11,729,308 28.470,352 1,810.466 175,568 0 3,618,999 4,839,960 23,630,392 Current Taxes Payable Current Portion of LT Debt Current Liabilities Total Liabilities Total Stockholders' Equity Cost of Goods Sold Operating Expenses (SG&A) 24.917,013 10,653,243 Panel B: Financial Ratios and Restatements, 2005-2007 2005 4493,827 7,395,828 Account (S) 5,156,520 Original Net Income Restated Net Income Original Income before Taxes 10,243,354 8,344,715 (continued on next page Issues in Accounting Education Volume 26, No. 3, 2011 560 Daugherty and Neely EXHIBIT 5 (continued) Account (S) Restated Income before Taxes Unauthorized Transactions Estimate: Per Fiscal Year 2005 2006 2007 2,257,079 2,284,1243,509,861 2009 10K-A Ratios (pre-restatement) Asset Turnover (Sales/Avg Total Assets) Inventory Tuover (COGS/Avg Inventories) Accounts Receivable Turnover (Sales/Avg A/R) Current Ratio (Current Assets/Current Liabilities) Quick Ratio ((Current Assets Inventories 1.52 2.77 6.26 5.78 3.38 3.38 4.45 2.65 0.60 3.43 6.53 2.76 1.61 /Current Liabilities) Net Working Capital Ratio ((Current Assets- 0.51 0.68 Current Liabilities) Total Assets) Debt to Equity (Total Liabilities/Total Stockholders Equity) Beneish Ratios (Financial Analysts Journal 1999) 0.32 0.48 0.22 Day's Sale in Receivable Index 0.62 1.28 0.94 0.25 0.94 Asset Quality Index Total Accruals to Total Assets 0.12 Panel B: Financial Ratios and Restatements, 2008 and 2009 Account (S) 2008 2009 Original Net Income Restated Net Income Original Income before Taxes Restated Income before Taxes Unauthorized Transactions Estimate: Per Fiscal Year 4,494.289 3,453,649 7,410,569 5,987.154 5,099,900 1,976,668 -257,158 2,887.730 -332,592 8.498.434 2009 10K-A Ratios (pre-restatement) Asset Turnover (Sales/Avg Total Assets) Inventory Turnover (COGS/Avg Inventories) Accounts Receivable Turnover (Sales/Avg A/R) Current Ratio (Current Assets/Current Liabilities) Quick Ratio ((Current Assets-Inventories) 1.59 1.31 2.60 4.06 3.02 4.32 2.64 0.62 0.29 Current Liabilities) Net Working Capital Ratio (Current Assets 0.61 Current LiabilitiesTotal Assets) Debt to Equity (Total Liabilities/Total Stockholders' Equity) 0.20 Beneish Ratios (Financial Analysts Journal 1999) Day's Sale in Receivable Index Asset Quality Index Total Accruals to Total Assets 1.26 1.05 0.05 0.00 All financial infomation taken from publicly available 10-K filings, available at: http://www.sec.gov Issues in Accounting Education Volume 26, No. 3,201Step by Step Solution
There are 3 Steps involved in it
Step: 1

Get Instant Access to Expert-Tailored Solutions
See step-by-step solutions with expert insights and AI powered tools for academic success
Step: 2

Step: 3
Ace Your Homework with AI
Get the answers you need in no time with our AI-driven, step-by-step assistance
Get Started
Cyber Security Auditing Assurance And Awareness Through CSAM And CATRAM
Authors: Regner Sabillon
1st Edition
1799856097, 978-1799856092