Statistical modelling;
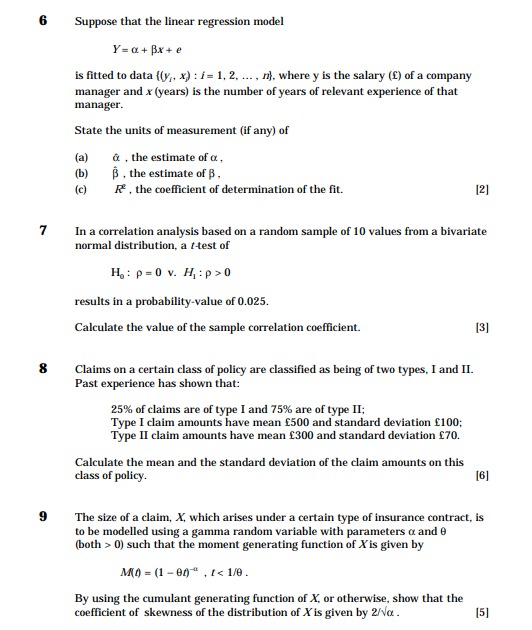
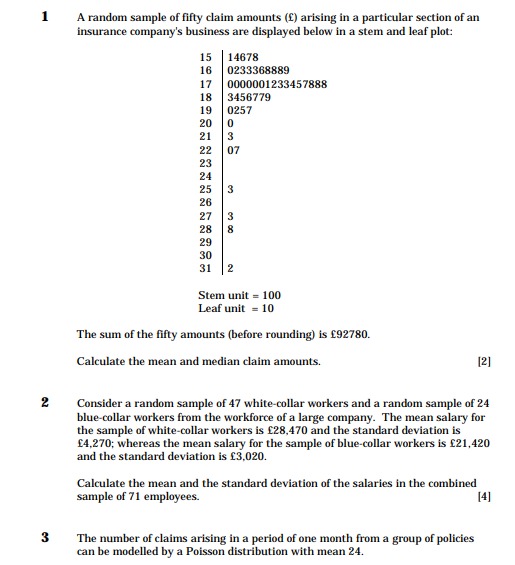
6 Suppose that the linear regression model Y= a + Bx + e is fitted to data ((y, x) : /= 1, 2. .... n), where y is the salary (f) of a company manager and x (years) is the number of years of relevant experience of that manager. State the units of measurement (if any) of (a) a , the estimate of a , (b) B , the estimate of p, (c) R , the coefficient of determination of the fit. [2] 7 In a correlation analysis based on a random sample of 10 values from a bivariate normal distribution, a f-test of H : p =0 v. H, : p>0 results in a probability-value of 0.025. Calculate the value of the sample correlation coefficient. [3] 8 Claims on a certain class of policy are classified as being of two types, I and II. Past experience has shown that: 25% of claims are of type I and 75% are of type II; Type I claim amounts have mean $500 and standard deviation $100; Type II claim amounts have mean 1300 and standard deviation $70. Calculate the mean and the standard deviation of the claim amounts on this class of policy. [6] 9 The size of a claim, X, which arises under a certain type of insurance contract, is to be modelled using a gamma random variable with parameters a and e (both > 0) such that the moment generating function of Xis given by MO = (1 - 01 , 1 =1/0. By using the cumulant generating function of X, or otherwise, show that the coefficient of skewness of the distribution of X is given by 2No . [5]1 A random sample of fifty claim amounts (f) arising in a particular section of an insurance company's business are displayed below in a stem and leaf plot: 15 14678 16 0233368889 17 0000001233457888 18 3456779 19 0257 20 0 21 3 22 07 23 24 25 3 26 27 3 28 29 30 31 2 Stem unit = 100 Leaf unit = 10 The sum of the fifty amounts (before rounding) is 192780. Calculate the mean and median claim amounts. [2] 2 Consider a random sample of 47 white-collar workers and a random sample of 24 blue-collar workers from the workforce of a large company. The mean salary for the sample of white-collar workers is (28,470 and the standard deviation is [4,270; whereas the mean salary for the sample of blue-collar workers is $21,420 and the standard deviation is $3,020. Calculate the mean and the standard deviation of the salaries in the combined sample of 71 employees. [4] 3 The number of claims arising in a period of one month from a group of policies can be modelled by a Poisson distribution with mean 24


