

Answered step by step
Verified Expert Solution
Question
1 Approved Answer
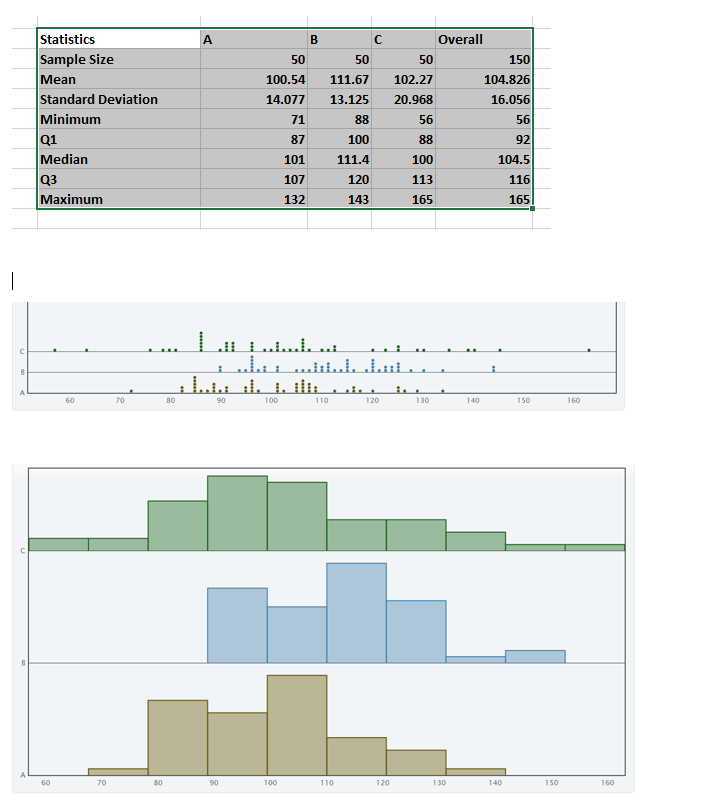
Statistics A B C Overall Sample Size 50 50 50 150 Mean 100.54 111.67 102.27 104.826 Standard Deviation 14.077 13.125 20.968 16.056 Minimum 71 88
Step by Step Solution
There are 3 Steps involved in it
Step: 1

Get Instant Access to Expert-Tailored Solutions
See step-by-step solutions with expert insights and AI powered tools for academic success
Step: 2

Step: 3
Ace Your Homework with AI
Get the answers you need in no time with our AI-driven, step-by-step assistance
Get Started
Advanced Calculus
Authors: R Creighton Buck
3rd Edition
147861613X, 9781478616139