Answered step by step
Verified Expert Solution
Link Copied!

Question

1 Approved Answer

Statistics AGE OF RESPONDENT N Valid 1494 Missing 6 Mean 47.69 Std. Deviation 17.381 Variance 302.102 Range 71 Percentiles 25 34.00 50 47.00 75 60.00
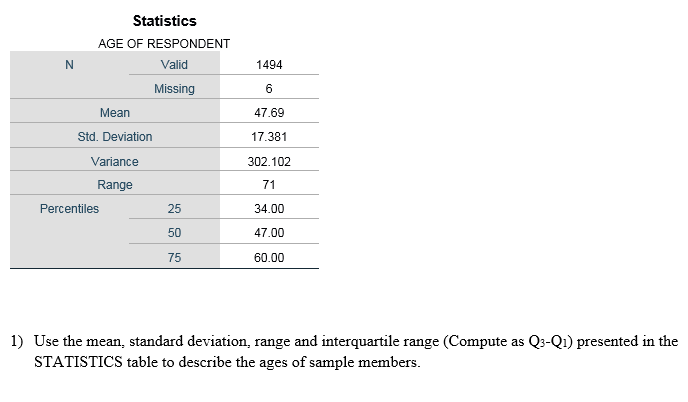
image text in transcribed
Statistics AGE OF RESPONDENT N Valid 1494 Missing 6 Mean 47.69 Std. Deviation 17.381 Variance 302.102 Range 71 Percentiles 25 34.00 50 47.00 75 60.00 1) Use the mean, standard deviation, range and interquartile range (Compute as Q3-Q1) presented in the STATISTICS table to describe the ages of sample members

Step by Step Solution

There are 3 Steps involved in it

Step: 1

blur-text-image

Get Instant Access to Expert-Tailored Solutions

See step-by-step solutions with expert insights and AI powered tools for academic success

Step: 2

blur-text-image

Step: 3

blur-text-image

Ace Your Homework with AI

Get the answers you need in no time with our AI-driven, step-by-step assistance

Get Started

Recommended Textbook for

Larson Algebra 1 California

Authors: Ron Larson, Laurie Boswell, Timothy D. Kanold, Lee Stiff

1st Edition

0618811761, 9780618811762

More Books

Students also viewed these Mathematics questions