[STATISTICS]
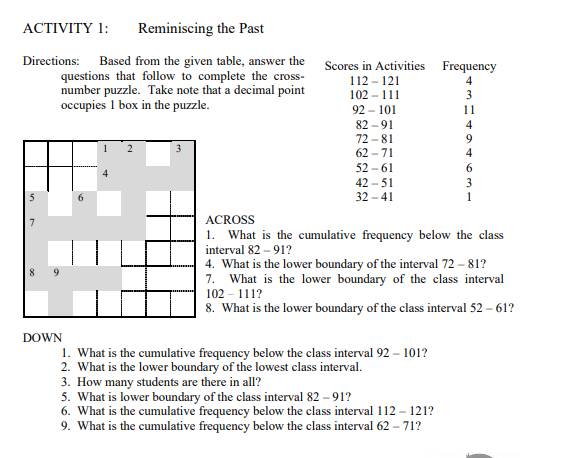
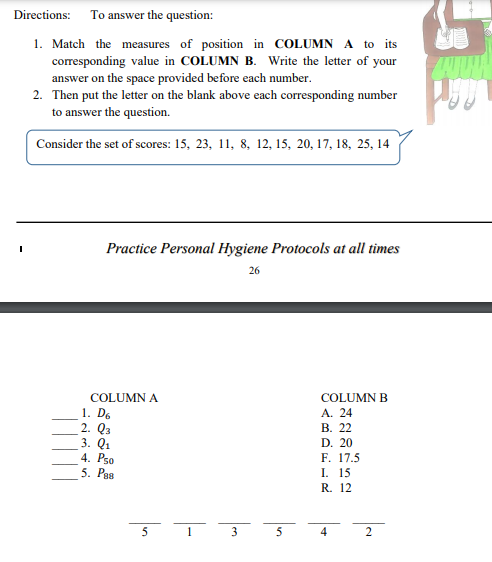
hELLO! need help with these activties. these are easy and i already have the answer key but i do not know how to solve it. can you show solution? i need computerized solutions since i find hard reading handwriting. thanks
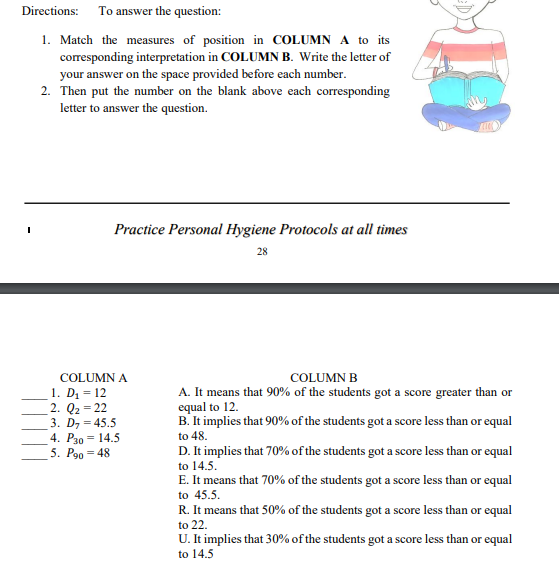
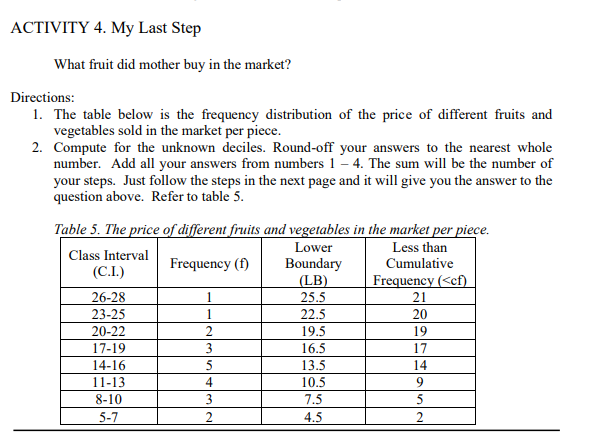
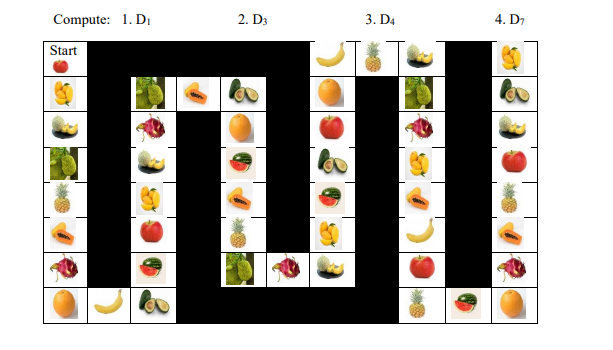
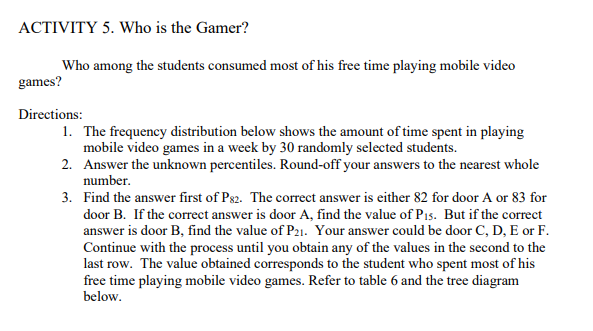
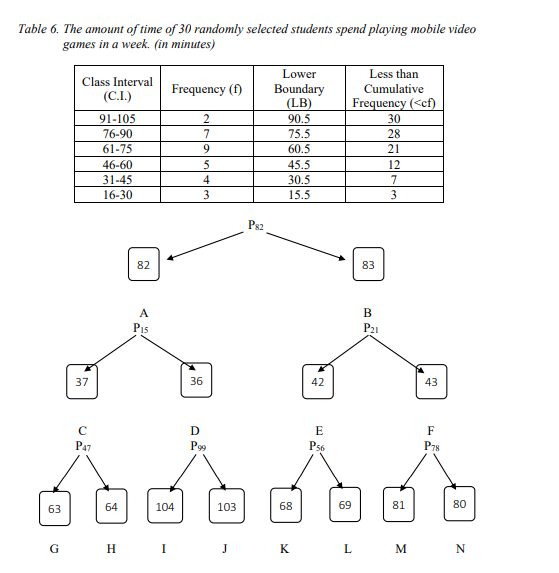
Directions: To answer the question: 1. Match the measures of position in COLUMN A to its corresponding interpretation in COLUMN B. Write the letter of your answer on the space provided before each number. 2. Then put the number on the blank above each corresponding letter to answer the question. Practice Personal Hygiene Protocols at all times 28 COLUMN A COLUMN B 1. D1 = 12 A. It means that 90% of the students got a score greater than or 2. Q2 = 22 equal to 12. 3. D, = 45.5 B. It implies that 90% of the students got a score less than or equal 4. P30 = 14.5 to 48. 5. Poo = 48 D. It implies that 70% of the students got a score less than or equal to 14.5. E. It means that 70% of the students got a score less than or equal to 45.5. R. It means that 50% of the students got a score less than or equal to 22 U. It implies that 30% of the students got a score less than or equal to 14.5ACTIVITY 4. My Last Step What fniit did mother bu},r in the market? Directions: 1. The table below is the frequency.r distribution of the price of different 'uits and vegetables sold in the market per piece. 2. Compute for the unknown deciles. Roundoff your answers to the nearest whole number. Add all your answers from numbers I 4. The sum will be the ntunber of your steps. Just follow the steps in the next page and it will give you the answer to the question above. Refer to table 5. Table .5. The .rr'cen d1] erem wits and vs rabies in the marker .er tees. Lower Less than Class Interval Frequency {f} Boundary Cumulative {CL} E Fre uenc sic 215-23 - 23-25 - 210-22 -IE- m -_ '- -as- 5-1 4. D7 Compute: 1. DI 2. D3 3. D4 Start TITeACTIVITY 5. Who is the Gamer? 1|Who among the students consurned most of his free time playing mobile video games? Directiom: l. The 'equency distribution below shows the amount of time spent in playing mobile video games in a week by 31!] randomly selected students. 2. Answer the unknown percentiles. Round-off your amwers to the nearest whole number. 3. Find the answer rst of P81. The correct answer is either 82 for door A or 83 for door H. Ifthe correct answer is door A. nd the value DTPIS. But ifthe correct answer is door E, find the value of P1]. Your answer could be door C, D. E or F. Continue with the process until you obtain any of the values in the second to the last row. The value obtained eorrespon$ to the student who spent most of his ne time playing mobile video games. Refer to table IIS and the tree diagram below. Table 6. The amount of time of 30 randomly selected students spend playing mobile video games in a week. (in minutes) Class Interval Lower Less than (C.I.) Frequency (f) Boundary Cumulative (LB) Frequency (
