

Answered step by step
Verified Expert Solution
Question
1 Approved Answer
Statistics Lab 3 b Spring 2 0 2 4 Prior to class on January 3 0 , enter your solutions to these problems using the
Statistics
Lab b
Spring
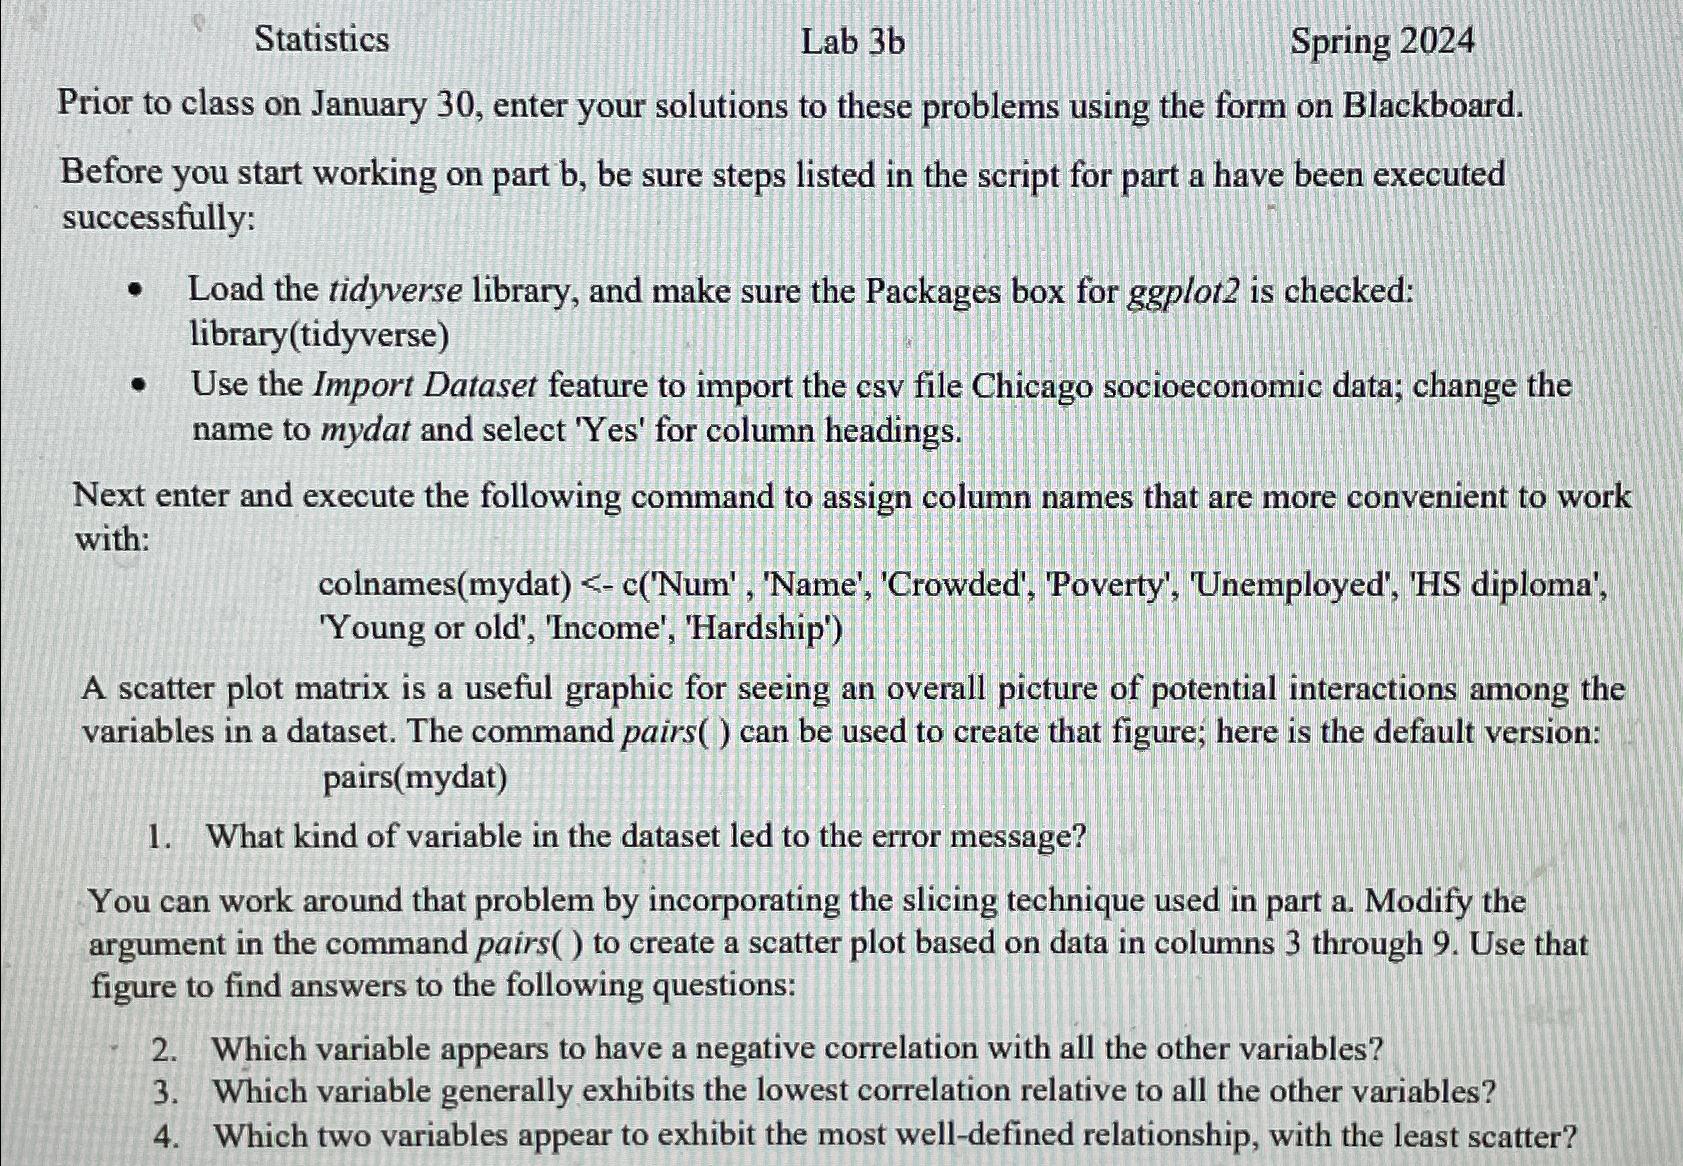
Prior to class on January enter your solutions to these problems using the form on Blackboard. Before you start working on part be sure steps listed in the script for part a have been executed successfully:
Load the tidyverse library, and make sure the Packages box for ggplot is checked: librarytidyverse
Use the Import Dataset feature to import the csv file Chicago socioeconomic data; change the name to mydat and select 'Yes' for column headings.
Next enter and execute the following command to assign column names that are more convenient to work with:
colnamesmydatcNum 'Name', 'Crowded', 'Poverty', 'Unemployed', HS diploma', 'Young or old', 'Income', 'Hardship'
A scatter plot matrix is a useful graphic for seeing an overall picture of potential interactions among the variables in a dataset. The command pairs can be used to create that figure; here is the default version: pairsmydat
What kind of variable in the dataset led to the error message?
You can work around that problem by incorporating the slicing technique used in part a Modify the argument in the command pairs to create a scatter plot based on data in columns through Use that figure to find answers to the following questions:
Which variable appears to have a negative correlation with all the other variables?
Which variable generally exhibits the lowest correlation relative to all the other variables?
Which two variables appear to exhibit the most welldefined relationship, with the least scatter?
Step by Step Solution
There are 3 Steps involved in it
Step: 1

Get Instant Access to Expert-Tailored Solutions
See step-by-step solutions with expert insights and AI powered tools for academic success
Step: 2

Step: 3
Ace Your Homework with AI
Get the answers you need in no time with our AI-driven, step-by-step assistance
Get Started
Data Management Databases And Organizations
Authors: Richard T. Watson
3rd Edition
0471418455, 978-0471418450