Answered step by step
Verified Expert Solution
Link Copied!

Question

1 Approved Answer

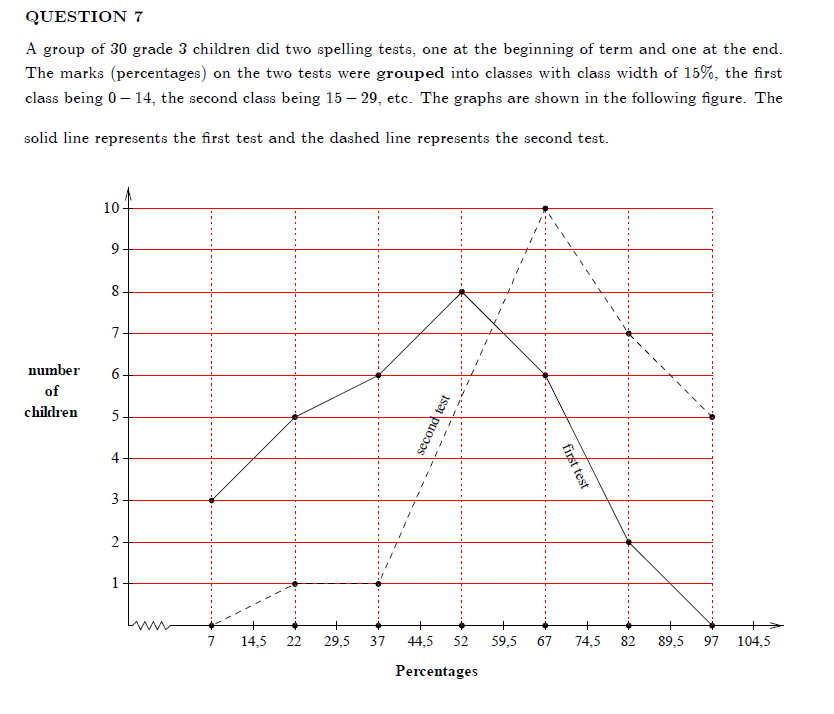
STATISTICS QUESTION 7 A group of 30 grade 3 children did two spelling tests, one at the beginning of term and one at the end.

STATISTICS

image text in transcribed
QUESTION 7 A group of 30 grade 3 children did two spelling tests, one at the beginning of term and one at the end. The marks (percentages) on the two tests were grouped into classes with class width of 15%, the first class being 0 -14, the second class being 15 -29, etc. The graphs are shown in the following figure. The solid line represents the first test and the dashed line represents the second test. 10 . number 6 of children second test 4 first test 3 - 2 - - - - - - - 1 $ - - - - - - - - - - - - - - - - - - - - - { - - - - - - -f - - - - - - { - - - - - -.3 -- - - - - { - - - - - - -[- - - - - - - - - - - - - - 7 14,5 22 29,5 37 44,5 52 59,5 67 74,5 82 89,5 97 104.5 Percentages

Step by Step Solution

There are 3 Steps involved in it

Step: 1

blur-text-image

Get Instant Access to Expert-Tailored Solutions

See step-by-step solutions with expert insights and AI powered tools for academic success

Step: 2

blur-text-image

Step: 3

blur-text-image

Ace Your Homework with AI

Get the answers you need in no time with our AI-driven, step-by-step assistance

Get Started

Recommended Textbook for

Quantitative Analysis For Management

Authors: Barry Render, Ralph M. Stair, Michael E. Hanna

11th Edition

9780132997621, 132149117, 132997622, 978-0132149112

Students also viewed these Mathematics questions