Answered step by step
Verified Expert Solution
Question
1 Approved Answer
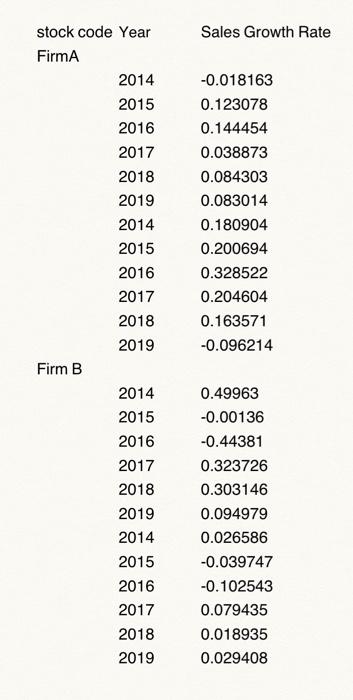
stock code Year FirmA Firm B 2014 2015 2016 2017 2018 2019 2014 2015 2016 2017 2018 2019 2014 2015 2016 2017 2018 2019


stock code Year FirmA Firm B 2014 2015 2016 2017 2018 2019 2014 2015 2016 2017 2018 2019 2014 2015 2016 2017 2018 2019 2014 2015 2016 2017 2018 2019 Sales Growth Rate -0.018163 0.123078 0.144454 0.038873 0.084303 0.083014 0.180904 0.200694 0.328522 0.204604 0.163571 -0.096214 0.49963 -0.00136 -0.44381 0.323726 0.303146 0.094979 0.026586 -0.039747 -0.102543 0.079435 0.018935 0.029408 , you are given some data on sales growth of firm A and firm B. In this question, you are asked to draw a Boxplot for each firm based on the given data. How do you compare sales growth between Firm A and Firm B using the two boxplots?
Step by Step Solution
★★★★★
3.42 Rating (146 Votes )
There are 3 Steps involved in it
Step: 1
To compare sales growth between Firm A and Firm B using the two boxplots we need to look at the dist...
Get Instant Access to Expert-Tailored Solutions
See step-by-step solutions with expert insights and AI powered tools for academic success
Step: 2

Step: 3

Ace Your Homework with AI
Get the answers you need in no time with our AI-driven, step-by-step assistance
Get Started


