Answered step by step
Verified Expert Solution
Question
1 Approved Answer
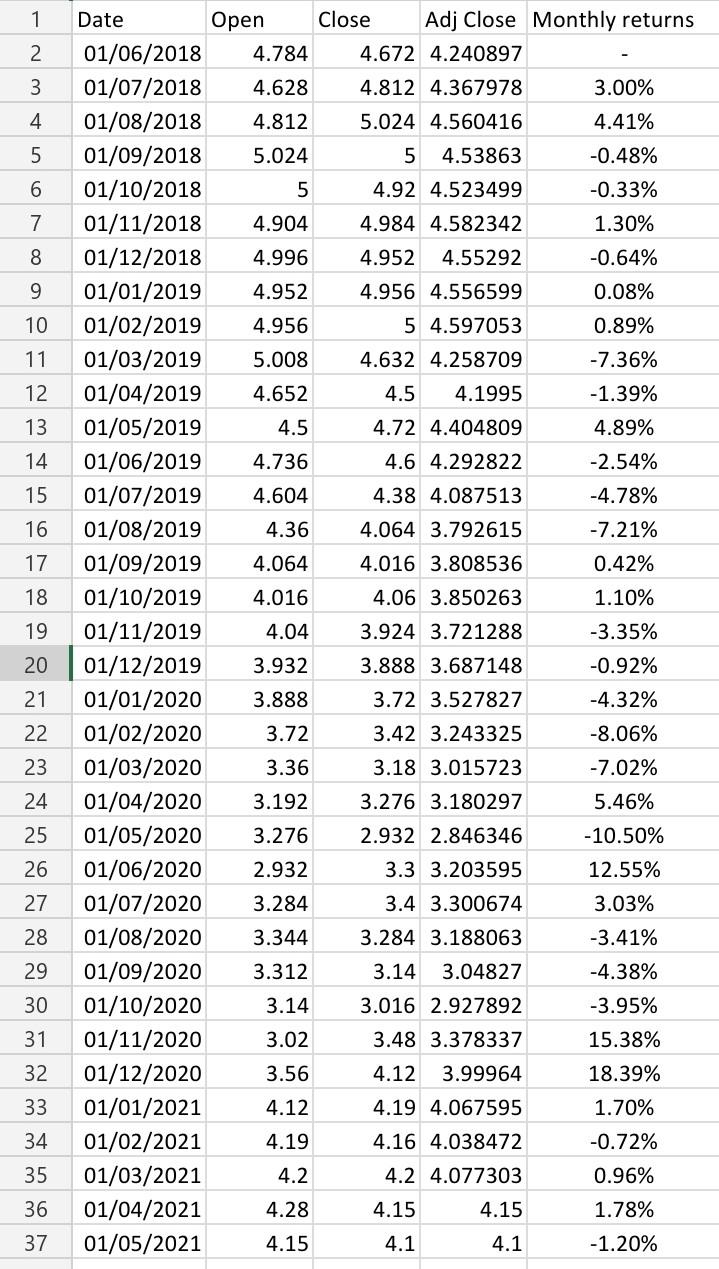
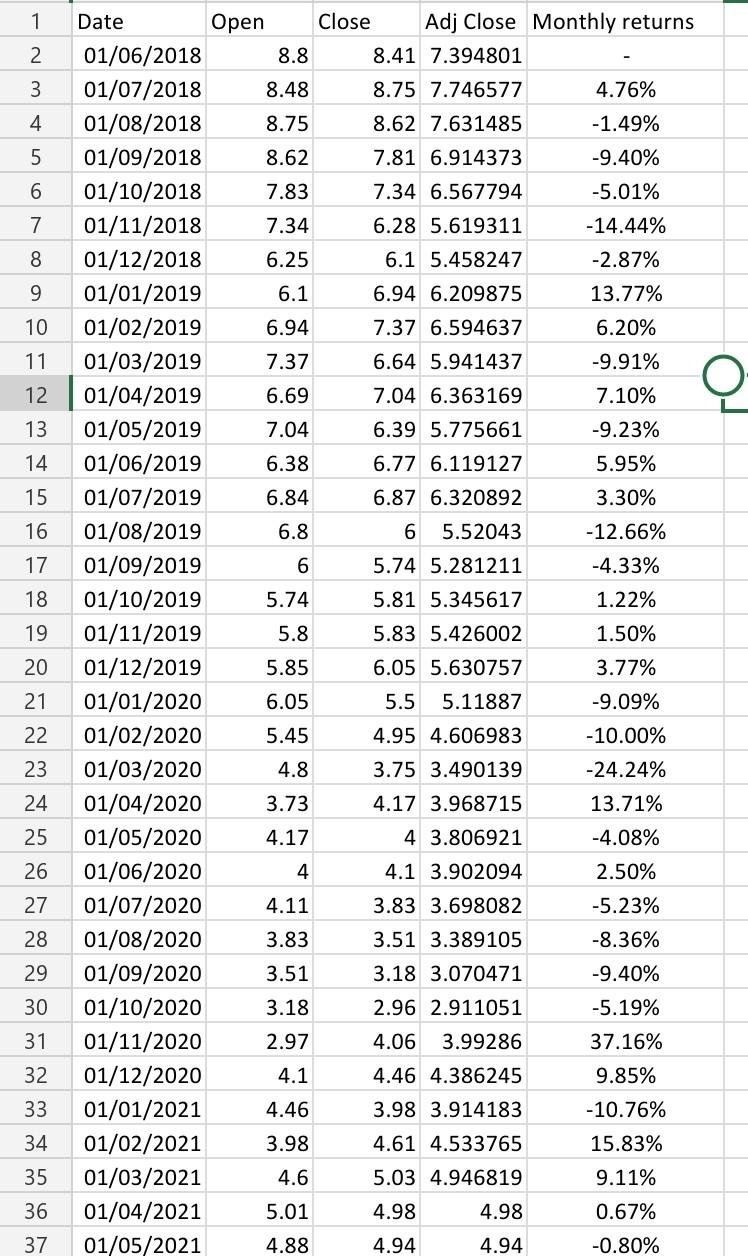
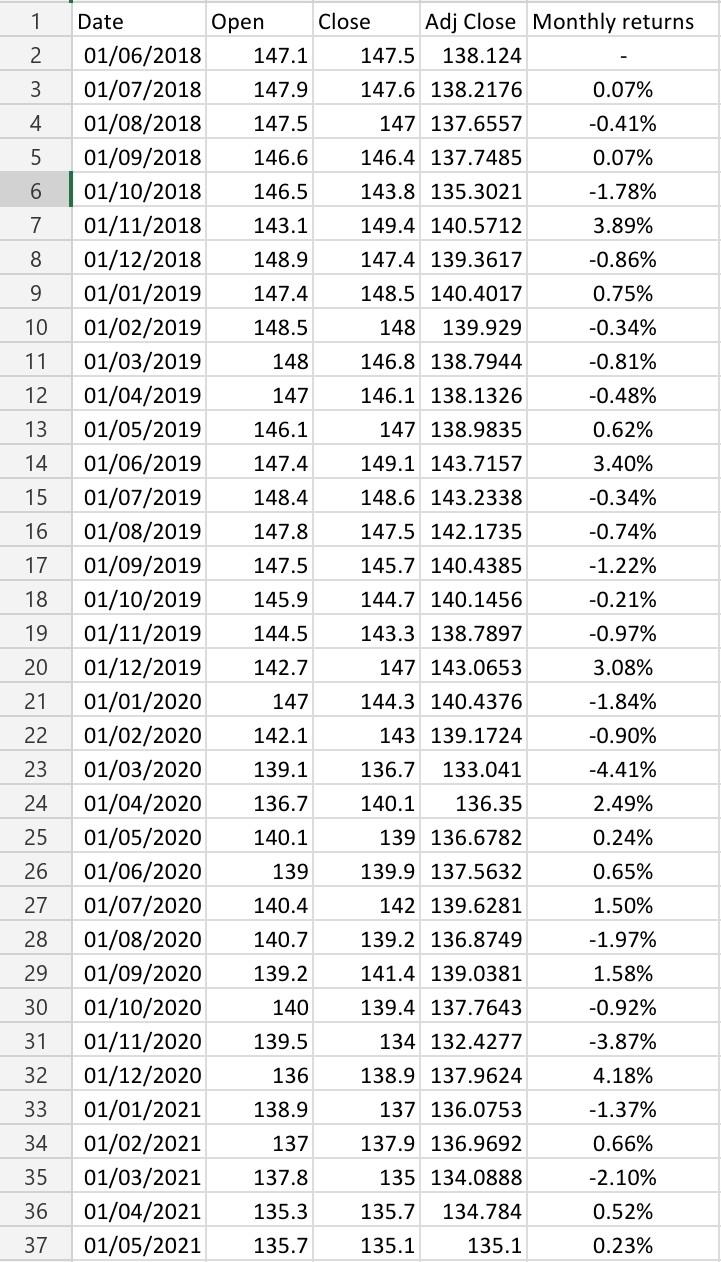
Stock Public Bank Stock Genting Stock Nestle Calculate the standard deviation of returns for a portfolio with equal investments in the 3 stocks. 1 2.

Stock Public Bank

Stock Genting

Stock Nestle
Calculate the standard deviation of returns for a portfolio with equal investments in the 3 stocks.
1 2. Date Open Close Adj Close Monthly returns 01/06/2018 4.784 4.672 4.240897 01/07/2018 4.628 4.812 4.367978 3.00% 3 4 4.812 5.024 4.560416 4.41% 5 5.024 5 4.53863 -0.48% 6 5 4.92 4.523499 -0.33% 7 4.904 4.984 4.582342 1.30% 8 4.996 4.952 4.55292 -0.64% 9 4.952 4.956 4.556599 0.08% 10 4.956 5 4.597053 0.89% 11 5.008 4.632 4.258709 -7.36% 12 4.652 4.5 4.1995 -1.39% 13 4.5 4.72 4.404809 4.89% 14 4.736 4.6 4.292822 -2.54% 15 4.604 4.38 4.087513 -4.78% 16 4.36 4.064 3.792615 -7.21% 17 4.064 4.016 3.808536 0.42% 18 4.016 4.06 3.850263 1.10% 19 4.04 3.924 3.721288 -3.35% 20 3.932 3.888 3.687148 -0.92% 01/08/2018 01/09/2018 01/10/2018 01/11/2018 01/12/2018 01/01/2019 01/02/2019 01/03/2019 01/04/2019 01/05/2019 01/06/201 01/07/2019 01/08/2019 01/09/2019 01/10/2019 01/11/2019 01/12/2019 01/01/2020 01/02/2020 01/03/2020 01/04/2020 01/05/2020 01/06/2020 01/07/2020 01/08/2020 01/09/2020 01/10/2020 01/11/2020 01/12/2020 01/01/2021 01/02/2021 01/03/2021 01/04/2021 01/05/2021 21 3.888 3.72 3.527827 -4.32% 22 3.72 3.42 3.243325 -8.06% 23 3.36 3.18 3.015723 -7.02% 24 3.192 3.276 3.180297 5.46% 25 3.276 2.932 2.846346 -10.50% 26 2.932 3.3 3.203595 12.55% 27 3.284 3.4 3.300674 3.03% 28 3.344 3.284 3.188063 -3.41% 29 3.312 3.14 3.04827 -4.38% 30 3.14 3.016 2.927892 -3.95% 31 3.02 3.48 3.378337 15.38% 32 3.56 4.12 3.99964 18.39% 33 4.12 4.19 4.067595 1.70% 34 4.19 4.16 4.038472 -0.72% 35 4.2 4.2 4.077303 0.96% 36 4.28 4.15 4.15 1.78% 37 4.15 4.1 4.1 -1.20% 1 2 3 Date Open Close Adj Close Monthly returns 01/06/2018 8.8 8.41 7.394801 01/07/2018 8.48 8.75 7.746577 4.76% 01/08/2018 8.75 8.62 7.631485 -1.49% 01/09/2018 8.62 7.81 6.914373 -9.40% 4 5 6 7.83 7.34 6.567794 -5.01% 7 7.34 6.28 5.619311 -14.44% 8 6.25 6.1 5.458247 -2.87% 9 6.1 6.94 6.209875 13.77% 10 6.94 7.37 6.594637 6.20% 11 7.37 6.64 5.941437 -9.91% 12 6.69 7.04 6.363169 7.10% 13 7.04 6.39 5.775661 -9.23% 14 6.38 6.77 6.119127 5.95% 15 6.84 6.87 6.320892 3.30% 16 6.8 6 5.52043 -12.66% 17 6 5.74 5.281211 -4.33% 18 5.74 5.81 5.345617 1.22% 19 5.8 5.83 5.426002 1.50% 20 5.85 6.05 5.630757 3.77% 21 6.05 5.5 5.11887 -9.09% 01/10/2018 01/11/2018 01/12/2018 01/01/2019 01/02/2019 01/03/2019 01/04/2019 01/05/2019 01/06/2019 01/07/2019 01/08/2019 01/09/2019 01/10/2019 01/11/2019 01/12/2019 01/01/2020 01/02/2020 01/03/2020 01/04/2020 01/05/2020 01/06/2020 01/07/2020 01/08/2020 01/09/2020 01/10/2020 01/11/2020 01/12/2020 01/01/2021 01/02/2021 01/03/2021 01/04/2021 01/05/2021 22 5.45 4.95 4.606983 -10.00% 23 4.8 3.75 3.490139 -24.24% 24 3.73 4.17 3.968715 13.71% 25 4.17 4 3.806921 -4.08% 26 4 4.1 3.902094 2.50% 27 4.11 3.83 3.698082 -5.23% 28 3.83 3.51 3.389105 -8.36% 29 3.51 3.18 3.070471 -9.40% 30 3.18 2.96 2.911051 -5.19% 31 2.97 4.06 3.99286 37.16% 32 4.1 4.46 4.386245 9.85% 33 4.46 3.98 3.914183 -10.76% 34 3.98 4.61 4.533765 15.83% 35 4.6 5.03 4.946819 9.11% 36 5.01 4.98 4.98 0.67% 37 4.88 4.94 4.94 -0.80% 1 2. Date Open Close Adj Close Monthly returns 01/06/2018 147.1 147.5 138.124 01/07/2018 147.9 147.6 138.2176 0.07% 3 4 147.5 147 137.6557 -0.41% 5 146.6 146.4 137.7485 0.07% 6 146.5 143.8 135.3021 -1.78% 7 143.1 149.4 140.5712 3.89% 8 148.9 147.4 139.3617 -0.86% 9 147.4 148.5 140.4017 0.75% 10 148.5 148 139.929 -0.34% 11 148 146.8 138.7944 -0.81% 12 147 146.1 138.1326 -0.48% 13 146.1 147 138.9835 0.62% 14 147.4 149.1 143.7157 3.40% 15 148.4 148.6 143.2338 -0.34% 16 147.8 147.5 142.1735 -0.74% 17 147.5 145.7 140.4385 -1.22% 18 145.9 144.7 140.1456 -0.21% 19 144.5 143.3 138.7897 -0.97% 20 01/08/2018 01/09/2018 01/10/2018 01/11/2018 01/12/2018 01/01/2019 01/02/2019 01/03/2019 01/04/2019 01/05/2019 01/06/2019 01/07/2019 01/08/2019 01/09/2019 01/10/2019 01/11/2019 01/12/2019 01/01/2020 01/02/2020 01/03/2020 01/04/2020 01/05/2020 01/06/2020 01/07/2020 01/08/2020 01/09/2020 01/10/2020 01/11/2020 01/12/2020 01/01/2021 01/02/2021 01/03/2021 01/04/2021 142.7 147 143.0653 3.08% 21 147 144.3 140.4376 -1.84% 22 142.1 143 139.1724 -0.90% 23 139.1 136.7 133.041 -4.41% 24 136.7 140.1 136.35 2.49% 25 140.1 139 136.6782 0.24% 26 139 139.9 137.5632 0.65% 27 140.4 142 139.6281 1.50% 28 140.7 139.2 136.8749 -1.97% 29 139.2 141.4 139.0381 1.58% 30 140 139.4 137.7643 -0.92% 31 139.5 134 132.4277 -3.87% 32 136 138.9 137.9624 4.18% 33 138.9 137 136.0753 -1.37% 34 137 137.9 136.9692 0.66% 35 137.8 135 134.0888 -2.10% 36 135.3 135.7 134.784 0.52% 37 01/05/2021 135.7 135.1 135.1 0.23%Step by Step Solution
There are 3 Steps involved in it
Step: 1

Get Instant Access to Expert-Tailored Solutions
See step-by-step solutions with expert insights and AI powered tools for academic success
Step: 2

Step: 3

Ace Your Homework with AI
Get the answers you need in no time with our AI-driven, step-by-step assistance
Get Started


