

Answered step by step
Verified Expert Solution
Question
1 Approved Answer
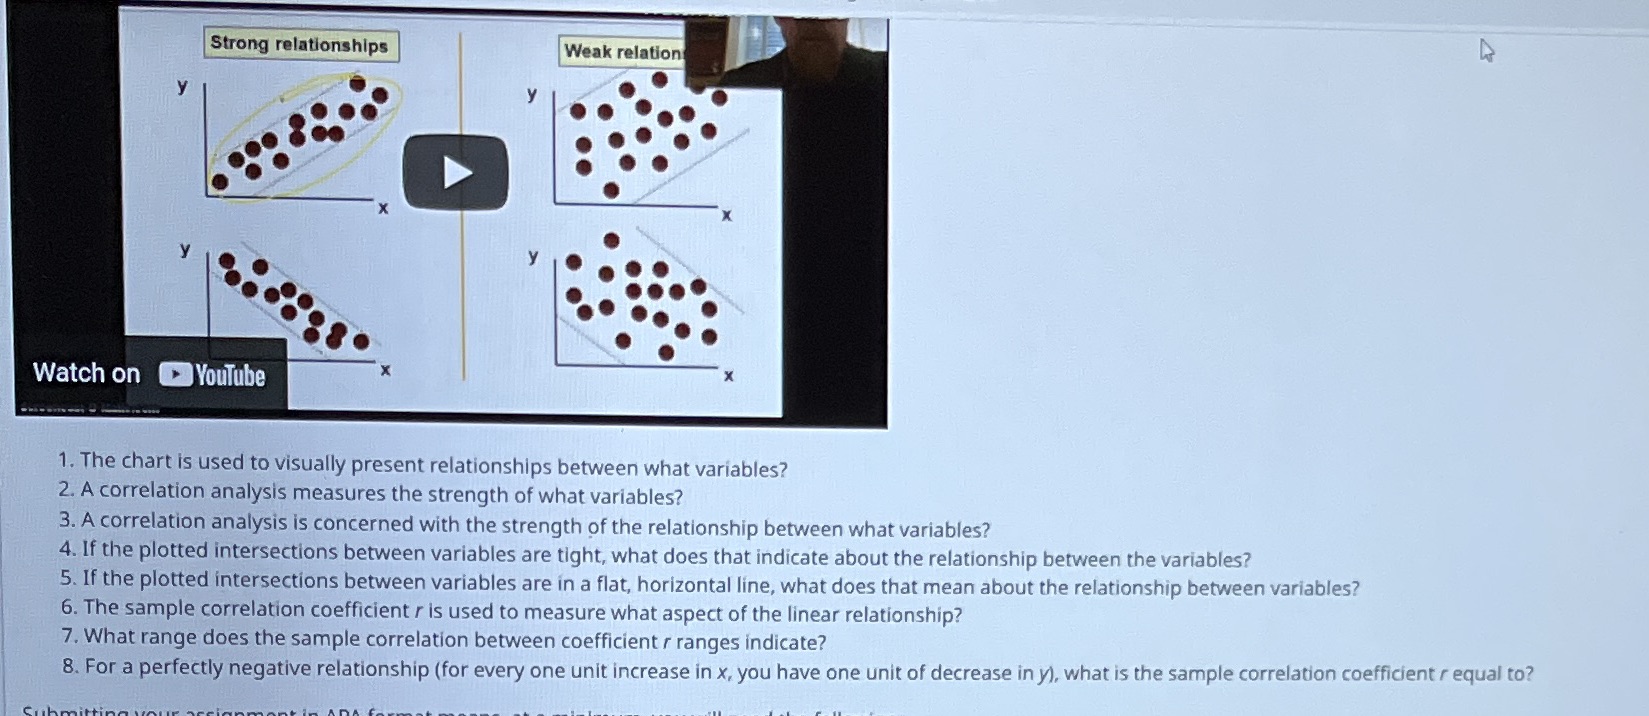
Strong relationships Weak relation y Watch on Youtube 1. The chart is used to visually present relationships between what variables? 2. A correlation analysis measures
Step by Step Solution
There are 3 Steps involved in it
Step: 1

Get Instant Access to Expert-Tailored Solutions
See step-by-step solutions with expert insights and AI powered tools for academic success
Step: 2

Step: 3
Ace Your Homework with AI
Get the answers you need in no time with our AI-driven, step-by-step assistance
Get Started
Research Design Qualitative Quantitative And Mixed Methods Approaches
Authors: John W. Creswell, J. David Creswell
6th International Edition
1071870637, 978-1071870631