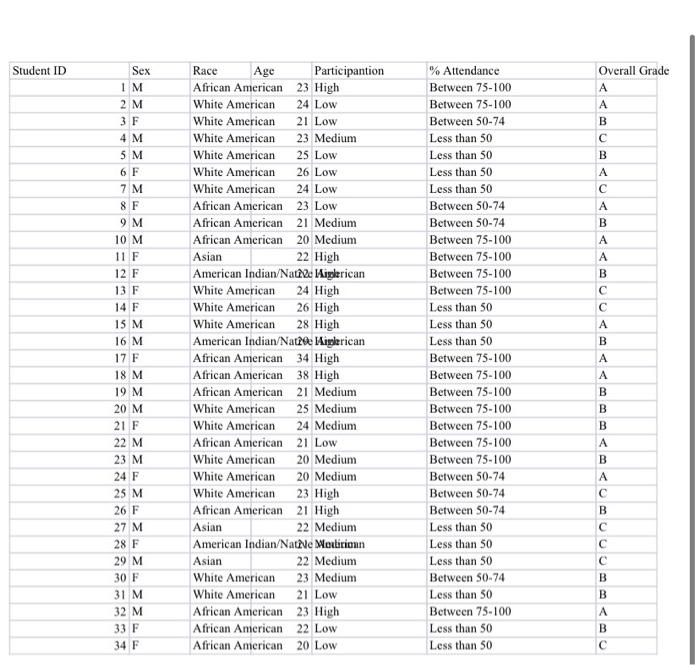
Student ID Overall Grade A A B B A C A B A A B A B Sex IM 2 M 3 F 4 M 5 M 6 F 7M 8 F 9 M 10 M 11 F 12 F 13 F 14 F 15 M 16 M 17 F 18 M 19 M 20 M 21 F 22 M 23 M 24 F 25 M 26 F 27 M 28 F 29 M 30 F 31 M 32 M 33 F 34 F Race Age Participantion African American 23 High White American 24 Low White American 21 Low White American 23 Medium White American 25 Low White American 26 Low White American 24 Low African American 23 Low African American 21 Medium African American 20 Medium Asian 22 High American Indian/Nattu Aiglerican White American 24 High White American 26 High White American 28 High American Indian/Nat2 laglerican African American 34 High African American 38 High African American 21 Medium White American 25 Medium White American 24 Medium African American 21 Low White American 20 Medium White American 20 Medium White American 23 High African American 21 High Asian 22 Medium American Indian/Nate Mortirionn Asian 22 Medium White American 23 Medium White American 21 Low African American 23 High African American 22 Low African American 20 Low % Attendance Between 75-100 Between 75-100 Between 50-74 Less than 50 Less than 50 Less than 50 Less than 50 Between 50-74 Between 50-74 Between 75-100 Between 75-100 Between 75-100 Between 75-100 Less than 50 Less than 50 Less than 50 Between 75-100 Between 75-100 Between 75-100 Between 75-100 Between 75-100 Between 75-100 Between 75-100 Between 50-74 Between 50-74 Between 50-74 Less than 50 Less than 50 Less than 50 Between 50-74 Less than 50 Between 75-100 Less than 50 Less than 50 A A B B B A B A B C B B B You will explore the excel data I provided (it is a hypothetical data created just for this exam). Answer the following questions: 1. List the number of variables in the data. Describe the categories of these variables based on the level of measurement (e.g. - Nominal, Continuous, Ordinal). (10) 2. Calculate the mean and standard deviation for variable 'age' in this sample. (5) 3. Provide a table of descriptive characteristics of the sample, (10) Suppose you want to explore the association between overall grade and % of attendance from this sample. 4. What is your outcome variable and exposure variable? (2) 5. State your hypothesis. (5) 6. Which variable (s) can act a confounder here and why? (3) 7. Create a table of exposure and outcome. (5) 8. Calculate the prevalence ratio. (Consider 'Less than 50' is your reference category) (4) 9. Provide your interpretation for both prevalence ratios. (4) 10. What is your conclusion? (2) Student ID Overall Grade A A B B A C A B A A B A B Sex IM 2 M 3 F 4 M 5 M 6 F 7M 8 F 9 M 10 M 11 F 12 F 13 F 14 F 15 M 16 M 17 F 18 M 19 M 20 M 21 F 22 M 23 M 24 F 25 M 26 F 27 M 28 F 29 M 30 F 31 M 32 M 33 F 34 F Race Age Participantion African American 23 High White American 24 Low White American 21 Low White American 23 Medium White American 25 Low White American 26 Low White American 24 Low African American 23 Low African American 21 Medium African American 20 Medium Asian 22 High American Indian/Nattu Aiglerican White American 24 High White American 26 High White American 28 High American Indian/Nat2 laglerican African American 34 High African American 38 High African American 21 Medium White American 25 Medium White American 24 Medium African American 21 Low White American 20 Medium White American 20 Medium White American 23 High African American 21 High Asian 22 Medium American Indian/Nate Mortirionn Asian 22 Medium White American 23 Medium White American 21 Low African American 23 High African American 22 Low African American 20 Low % Attendance Between 75-100 Between 75-100 Between 50-74 Less than 50 Less than 50 Less than 50 Less than 50 Between 50-74 Between 50-74 Between 75-100 Between 75-100 Between 75-100 Between 75-100 Less than 50 Less than 50 Less than 50 Between 75-100 Between 75-100 Between 75-100 Between 75-100 Between 75-100 Between 75-100 Between 75-100 Between 50-74 Between 50-74 Between 50-74 Less than 50 Less than 50 Less than 50 Between 50-74 Less than 50 Between 75-100 Less than 50 Less than 50 A A B B B A B A B C B B B You will explore the excel data I provided (it is a hypothetical data created just for this exam). Answer the following questions: 1. List the number of variables in the data. Describe the categories of these variables based on the level of measurement (e.g. - Nominal, Continuous, Ordinal). (10) 2. Calculate the mean and standard deviation for variable 'age' in this sample. (5) 3. Provide a table of descriptive characteristics of the sample, (10) Suppose you want to explore the association between overall grade and % of attendance from this sample. 4. What is your outcome variable and exposure variable? (2) 5. State your hypothesis. (5) 6. Which variable (s) can act a confounder here and why? (3) 7. Create a table of exposure and outcome. (5) 8. Calculate the prevalence ratio. (Consider 'Less than 50' is your reference category) (4) 9. Provide your interpretation for both prevalence ratios. (4) 10. What is your conclusion? (2)