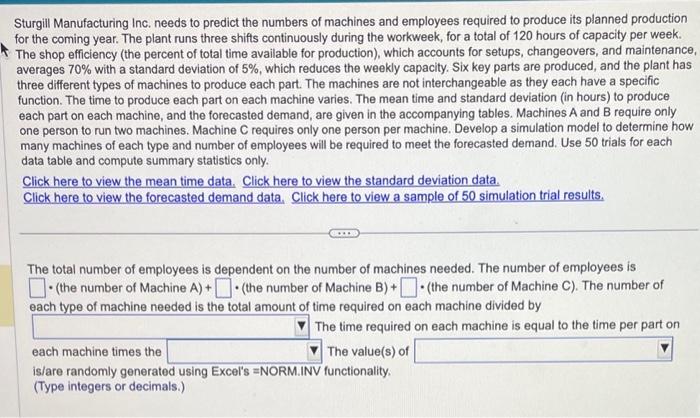
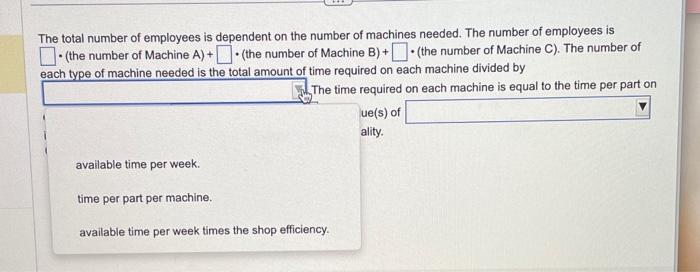
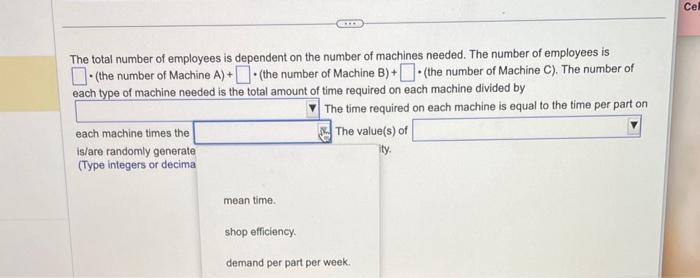
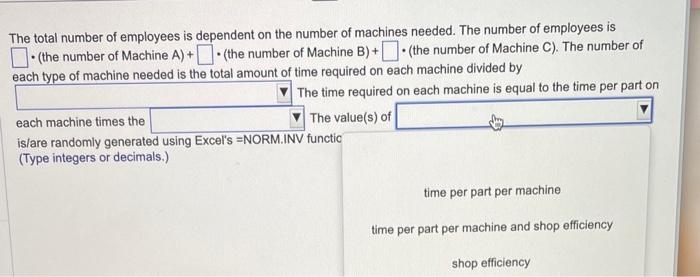
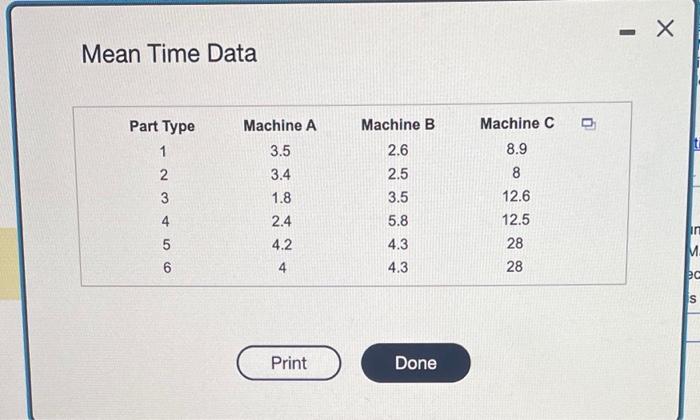
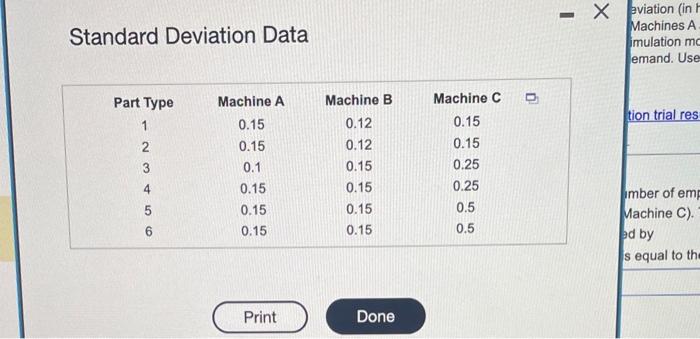
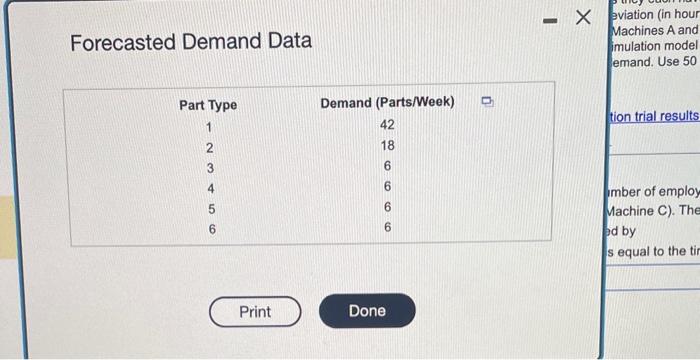
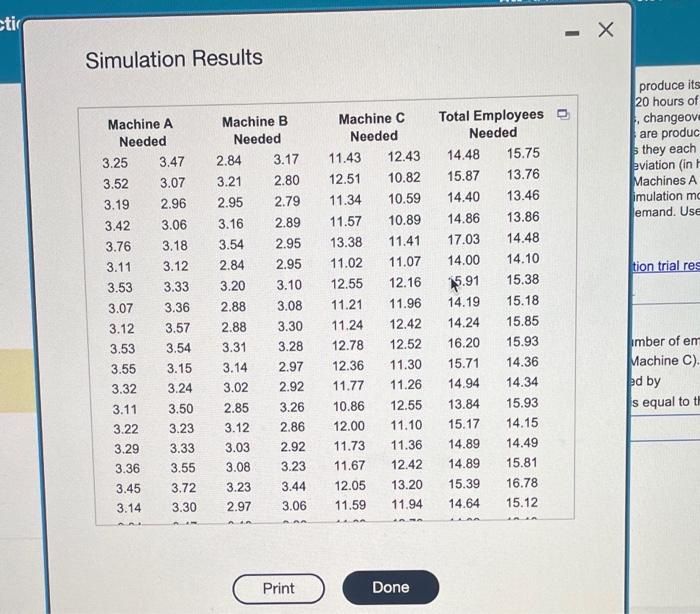
Sturgill Manufacturing Inc. needs to predict the numbers of machines and employees required to produce its planned production for the coming year. The plant runs three shifts continuously during the workweek, for a total of 120 hours of capacity per week. The shop efficiency (the percent of total time available for production), which accounts for setups, changeovers, and maintenance, averages 70% with a standard deviation of 5%, which reduces the weekly capacity. Six key parts are produced, and the plant has three different types of machines to produce each part. The machines are not interchangeable as they each have a specific function. The time to produce each part on each machine varies. The mean time and standard deviation (in hours) to produce each part on each machine, and the forecasted demand, are given in the accompanying tables. Machines A and B require only one person to run two machines. Machine C requires only one person per machine. Develop a simulation model to determine how many machines of each type and number of employees will be required to meet the forecasted demand. Use 50 trials for each data table and compute summary statistics only. Click here to view the mean time data. Click here to view the standard deviation data. Click here to view the forecasted demand data. Click here to view a sample of 50 simulation trial results. The total number of employees is dependent on the number of machines needed. The number of employees is - (the number of Machine A)+ (the number of Machine B) + (the number of Machine C). The number of each type of machine needed is the total amount of time required on each machine divided by The time required on each machine is equal to the time per part on each machine times the The value(s) of is/are randomly generated using Excel's =NORM. INV functionality. (Type integers or decimals.) The total number of employees is dependent on the number of machines needed. The number of employees is - (the number of Machine A)+ (the number of Machine B) + (the number of Machine C). The number of each tvpe of machine needed is the total amount of time required on each machine divided by The time required on each machine is equal to the time per part on ue(s) of ality. available time per week. time per part per machine. available time per week times the shop efficiency. The total number of employees is dependent on the number of machines needed. The number of employees is - (the number of Machine A)+ (the number of Machine B)+ (the number of Machine C). The number of each type of machine needed is the total amount of time required on each machine divided by The time required on each machine is equal to the time per part on each machine times the is/are randomly generate (Type integers or decima The total number of employees is dependent on the number of machines needed. The number of employees is - (the number of Machine A)+ - (the number of Machine B) + (the number of Machine C). The number of each tvoe of machine needed is the total amount of time required on each machine divided by The time required on each machine is equal to the time per part on each machine times the The value(s) of is/are randomly generated using Excel's =NORM.INV functic (Type integers or decimals.) time per part per machine time per part per machine and shop efficiency Mean Time Data Standard Deviation Data gviation (in hour Forecasted Demand Data achines A and emand. Use 50 tion trial results imber of employ Machine C). The bd by s equal to the Simulation Results 3.343.403.313.513.093.213.853.473.423.453.423.743.173.153.133.123.083.232.973.023.563.263.223.203.283.422.902.9411.6912.0111.6212.4211.3311.6913.4312.7612.2412.1412.4213.0811.0711.0714.9215.2714.8215.7914.3714.8117.1316.1315.5615.4615.7716.6614.1114.11 Sturgill Manufacturing Inc. needs to predict the numbers of machines and employees required to produce its planned production for the coming year. The plant runs three shifts continuously during the workweek, for a total of 120 hours of capacity per week. The shop efficiency (the percent of total time available for production), which accounts for setups, changeovers, and maintenance, averages 70% with a standard deviation of 5%, which reduces the weekly capacity. Six key parts are produced, and the plant has three different types of machines to produce each part. The machines are not interchangeable as they each have a specific function. The time to produce each part on each machine varies. The mean time and standard deviation (in hours) to produce each part on each machine, and the forecasted demand, are given in the accompanying tables. Machines A and B require only one person to run two machines. Machine C requires only one person per machine. Develop a simulation model to determine how many machines of each type and number of employees will be required to meet the forecasted demand. Use 50 trials for each data table and compute summary statistics only. Click here to view the mean time data. Click here to view the standard deviation data. Click here to view the forecasted demand data. Click here to view a sample of 50 simulation trial results. The total number of employees is dependent on the number of machines needed. The number of employees is - (the number of Machine A)+ (the number of Machine B) + (the number of Machine C). The number of each type of machine needed is the total amount of time required on each machine divided by The time required on each machine is equal to the time per part on each machine times the The value(s) of is/are randomly generated using Excel's =NORM. INV functionality. (Type integers or decimals.) The total number of employees is dependent on the number of machines needed. The number of employees is - (the number of Machine A)+ (the number of Machine B) + (the number of Machine C). The number of each tvpe of machine needed is the total amount of time required on each machine divided by The time required on each machine is equal to the time per part on ue(s) of ality. available time per week. time per part per machine. available time per week times the shop efficiency. The total number of employees is dependent on the number of machines needed. The number of employees is - (the number of Machine A)+ (the number of Machine B)+ (the number of Machine C). The number of each type of machine needed is the total amount of time required on each machine divided by The time required on each machine is equal to the time per part on each machine times the is/are randomly generate (Type integers or decima The total number of employees is dependent on the number of machines needed. The number of employees is - (the number of Machine A)+ - (the number of Machine B) + (the number of Machine C). The number of each tvoe of machine needed is the total amount of time required on each machine divided by The time required on each machine is equal to the time per part on each machine times the The value(s) of is/are randomly generated using Excel's =NORM.INV functic (Type integers or decimals.) time per part per machine time per part per machine and shop efficiency Mean Time Data Standard Deviation Data gviation (in hour Forecasted Demand Data achines A and emand. Use 50 tion trial results imber of employ Machine C). The bd by s equal to the Simulation Results 3.343.403.313.513.093.213.853.473.423.453.423.743.173.153.133.123.083.232.973.023.563.263.223.203.283.422.902.9411.6912.0111.6212.4211.3311.6913.4312.7612.2412.1412.4213.0811.0711.0714.9215.2714.8215.7914.3714.8117.1316.1315.5615.4615.7716.6614.1114.11
