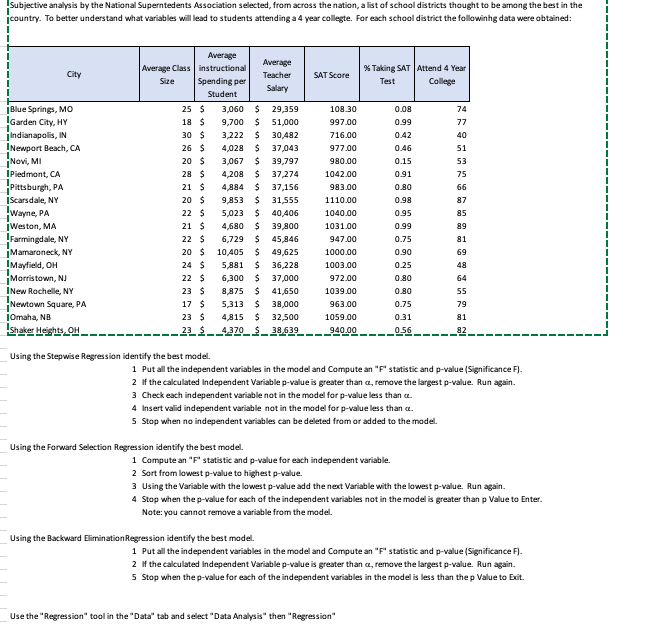
Subjective analysis by the National Superntedents Association selected, from across the nation, a list of school districts thought to be among the best in the jcountry. To better understand what variables will lead to students attending a 4 year college. For each school district the followinng data were obtained: Average Average Class instructional Average * Taking SAT | Attend 4 Year City SAT Score Size Spending per Teacher Test College Salary Student | Blue Springs, MO 25 5 3,060 29,359 108.30 0.08 74 Garden City, HY 18 $ 9,700 51,000 997 00 0.99 77 i Indianapolis, IN 30 $ 3,222 30,482 716 00 0.42 40 !Newport Beach, CA 26 $ 4,028 37,043 97700 0.46 51 Novi, MI 20 $ 3,067 39,797 DO 086 0.15 53 I Piedmont, CA 28 $ 4,208 37,274 1042.00 0.91 75 HPittsburgh, PA 21 $ 4,884 37,156 983.00 0.80 66 I Scarsdale, NY 20 $ 9,853 31,555 1110.00 0.98 87 Wayne, PA 22 $ 5,023 $ 40,406 1040 00 0.95 85 | Weston, MA 21 $ 4,680 39,800 1031 00 0.99 89 -Farmingdale, NY 22 $ 6,729 45,846 947 00 0.75 81 Mamaroneck, NY 20 $ 10,405 49,625 1000.00 0.90 69 ! Mayfield, OH 24 $ 5,881 36,228 100300 0.25 48 Morristown, NJ 22 $ 6,300 37,000 972 00 0.80 64 I New Rochelle, NY 23 $ 8,875 41,650 1039 00 0.80 55 -Newtown Square, PA 17 $ 5,313 $ 38,000 163.00 0.75 79 IOmaha, NO 23 $ 4,815 $ 32,500 1059 00 0.31 B1 Shaver Hesits OH--- -- 2134370_6_38.639 940 09 -_ _29- Using the Stepwise Regression identify the best model. 1 Put all the independent variables in the model and Compute an "F' statistic and p-value (Significance F]- 2 If the calculated Independent Variable p-value is greater than a, remove the largest p-value. Run again. 3 Check each independent variable not in the model for p-value less than a. 4 Insert valid independent variable not in the model for p-value less than a. 5 Stop when no independent variables can be deleted from or added to the model. Using the Forward Selection Regression identify the best model. 1 Compute an "F" statistic and p-value for each independent variable. 2 Sort from lowest p-value to highest p-value. 3 Using the Variable with the lowest p-value add the next Variable with the lowest p-value. Run again. 4 Stop when the p-value for each of the independent variables not in the model is greater than p Value to Enter. Note: you cannot remove a variable from the model. Using the Backward Elimination Regression identify the best model. 1 Put all the independent variables in the model and Compute an "F' statistic and p-value (Significance F). 2 If the calculated Independent Variable p-value is greater than a, remove the largest p-value. Run again. 5 Stop when the p-value for each of the independent variables in the model is less than the p Value to Exit. Use the "Regression" tool in the "Data" tab and select "Data Analysis" then "Regression"