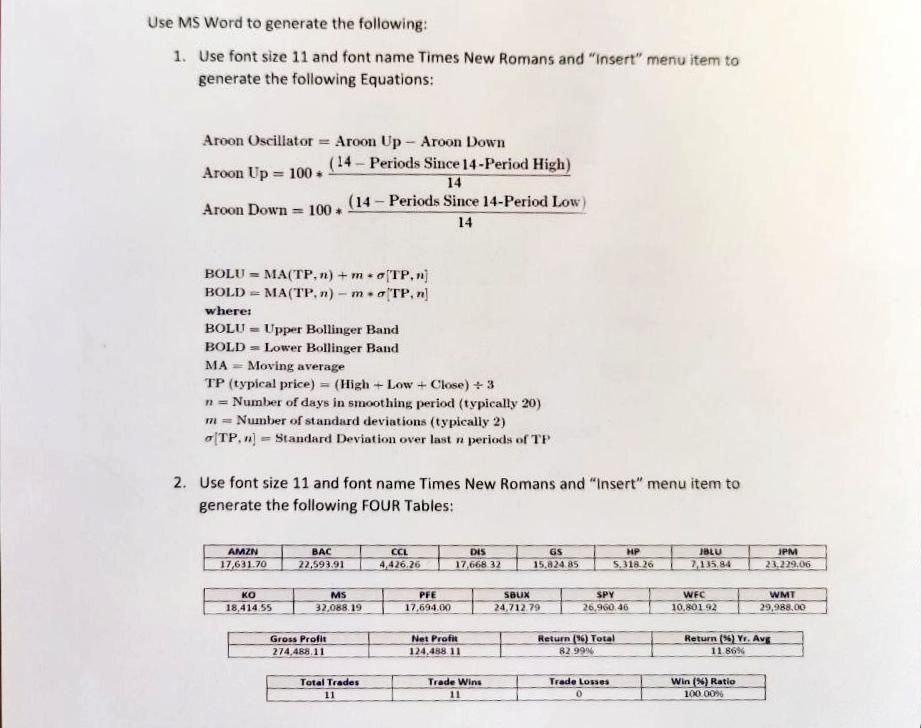
Question: submit a MS word file that shows your designed tables, equations and the chart. 3- Use font size 11 and font name Times New Romans
submit a MS word file that shows your designed tables, equations and the chart.

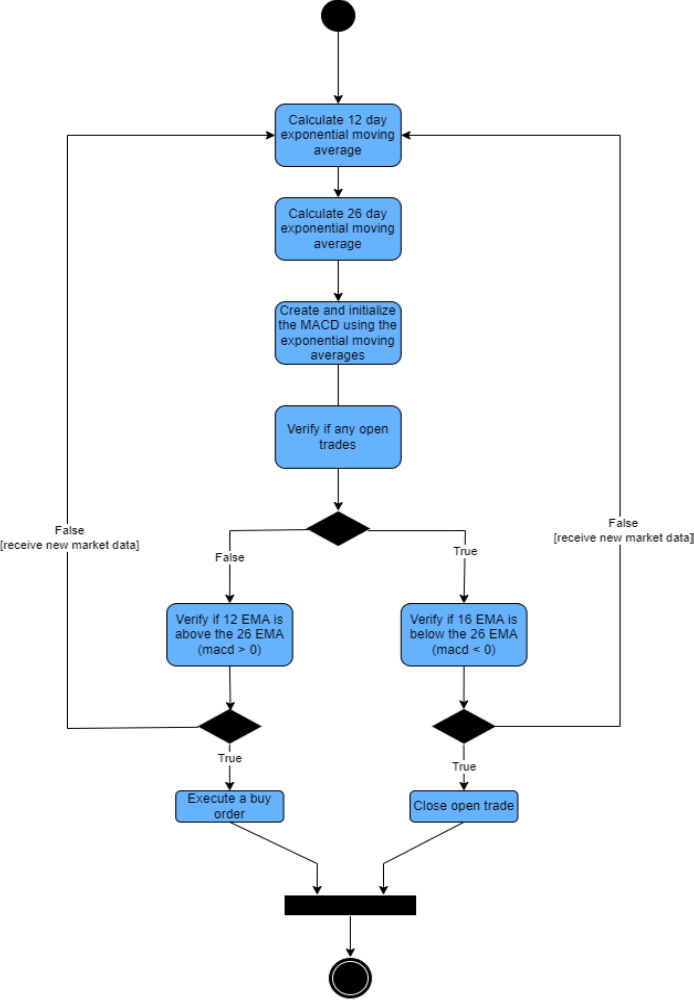
3- Use font size 11 and font name Times New Romans and "insert" menu item to generate the following chart:

Use MS Word to generate the following: 1. Use font size 11 and font name Times New Romans and "Insert" menu item to generate the following Equations: Aroon Uscillator = Aroon Up - Aroon Down Aroon Up =10014(14-PeriodsSince14-PeriodHigh) Aroon Down =10014(14PeriodsSince14-PeriodLow) BOLU=MA(TP,n)+m[TP,n] BOLD=MA(TP,n)m[TP,n] where: BOLU= Upper Bollinger Band BOLD= Lower Bollinger Band MA= Moving average TP ( typical price )=( High + Low + Close )3 n= Number of days in smoothing period (typically 20 ) m= Number of standard deviations (typicaliy 2 ) [TP,n]=S tandard Deviation over last n periods of TP 2. Use font size 11 and font name Times New Romans and "Insert" menu item to generate the following FOUR Tables: - 1+
Step by Step Solution
There are 3 Steps involved in it

Get step-by-step solutions from verified subject matter experts


