

Answered step by step
Verified Expert Solution
Question
1 Approved Answer
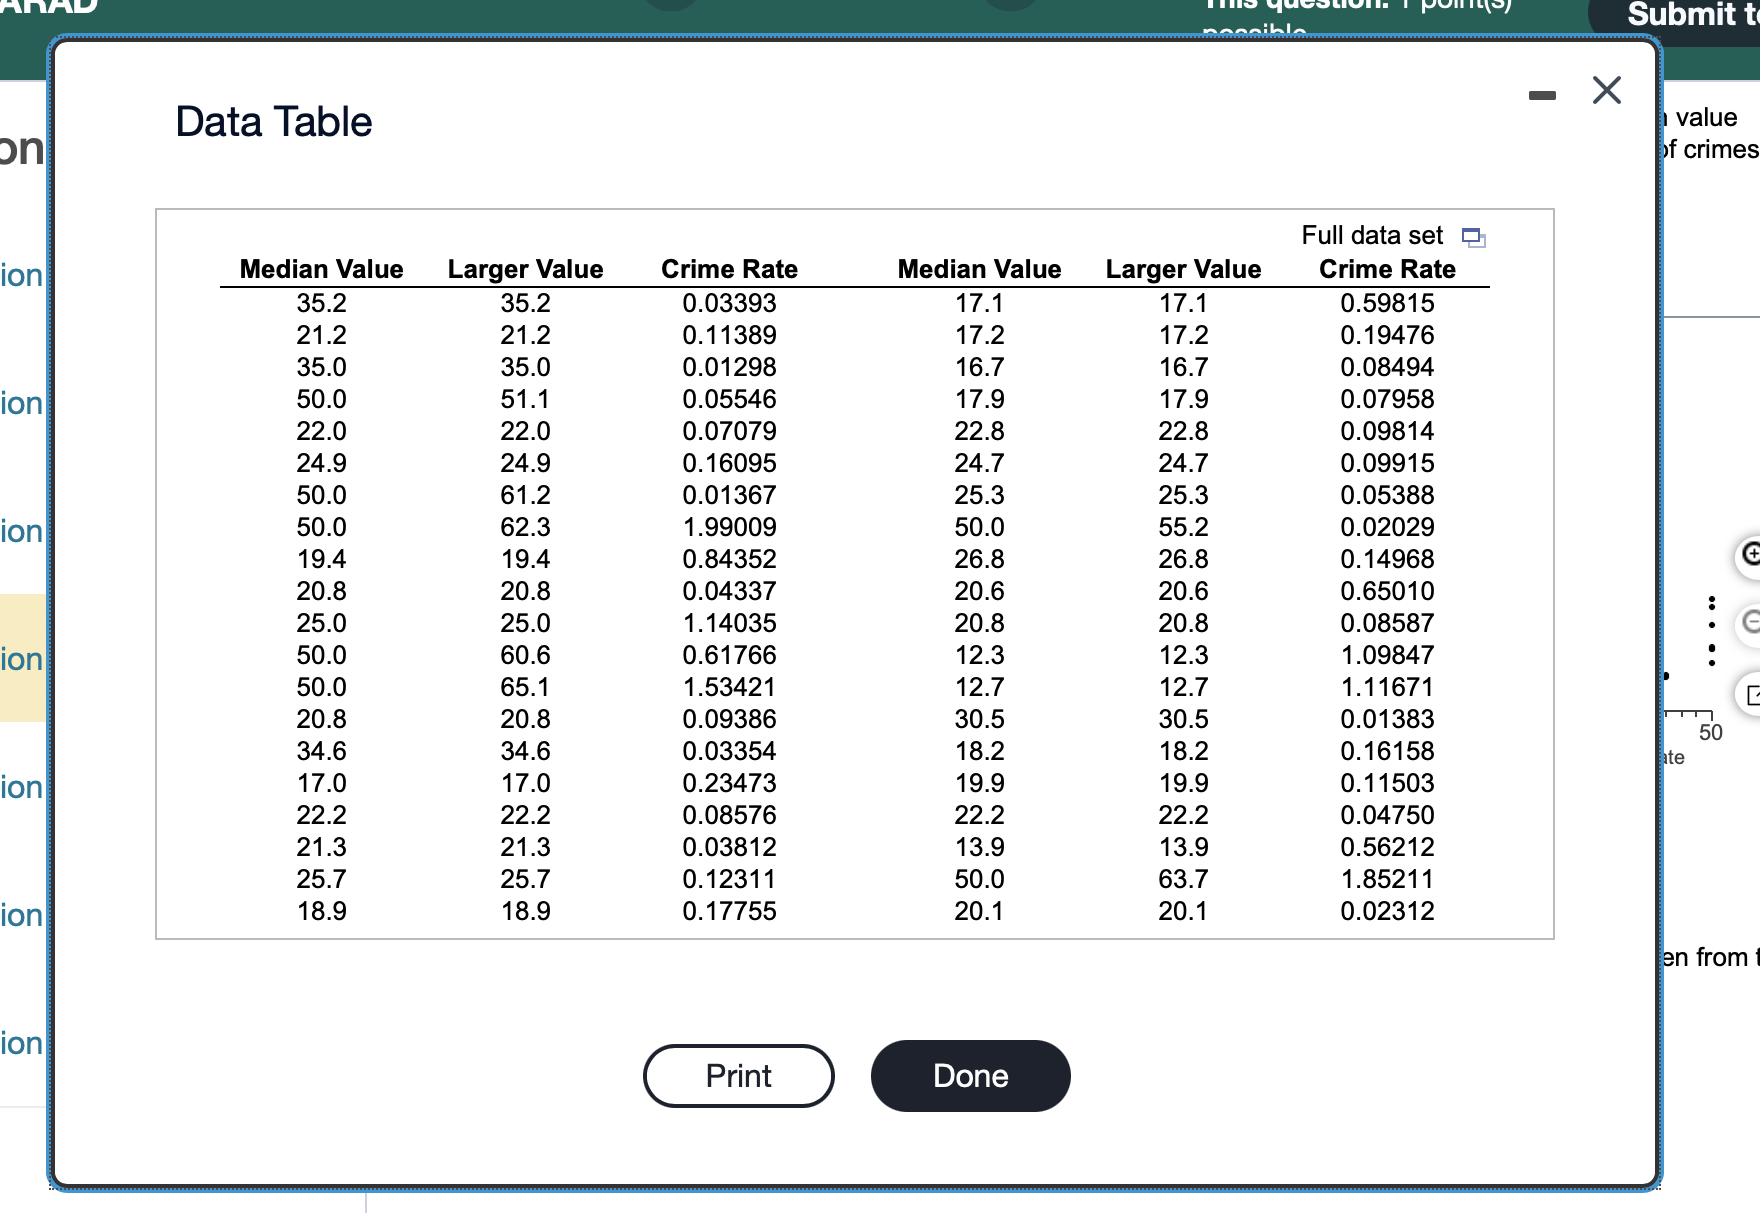
Submit t Data Table - X value on of crimes Full data set ion Median Value Larger Value Crime Rate Median Value Larger Value Crime


Step by Step Solution
There are 3 Steps involved in it
Step: 1

Get Instant Access to Expert-Tailored Solutions
See step-by-step solutions with expert insights and AI powered tools for academic success
Step: 2

Step: 3
Ace Your Homework with AI
Get the answers you need in no time with our AI-driven, step-by-step assistance
Get Started
Geometry From Euclid To Knots
Authors: Saul Stahl
1st Edition
0486134989, 9780486134987