

Answered step by step
Verified Expert Solution
Question
1 Approved Answer
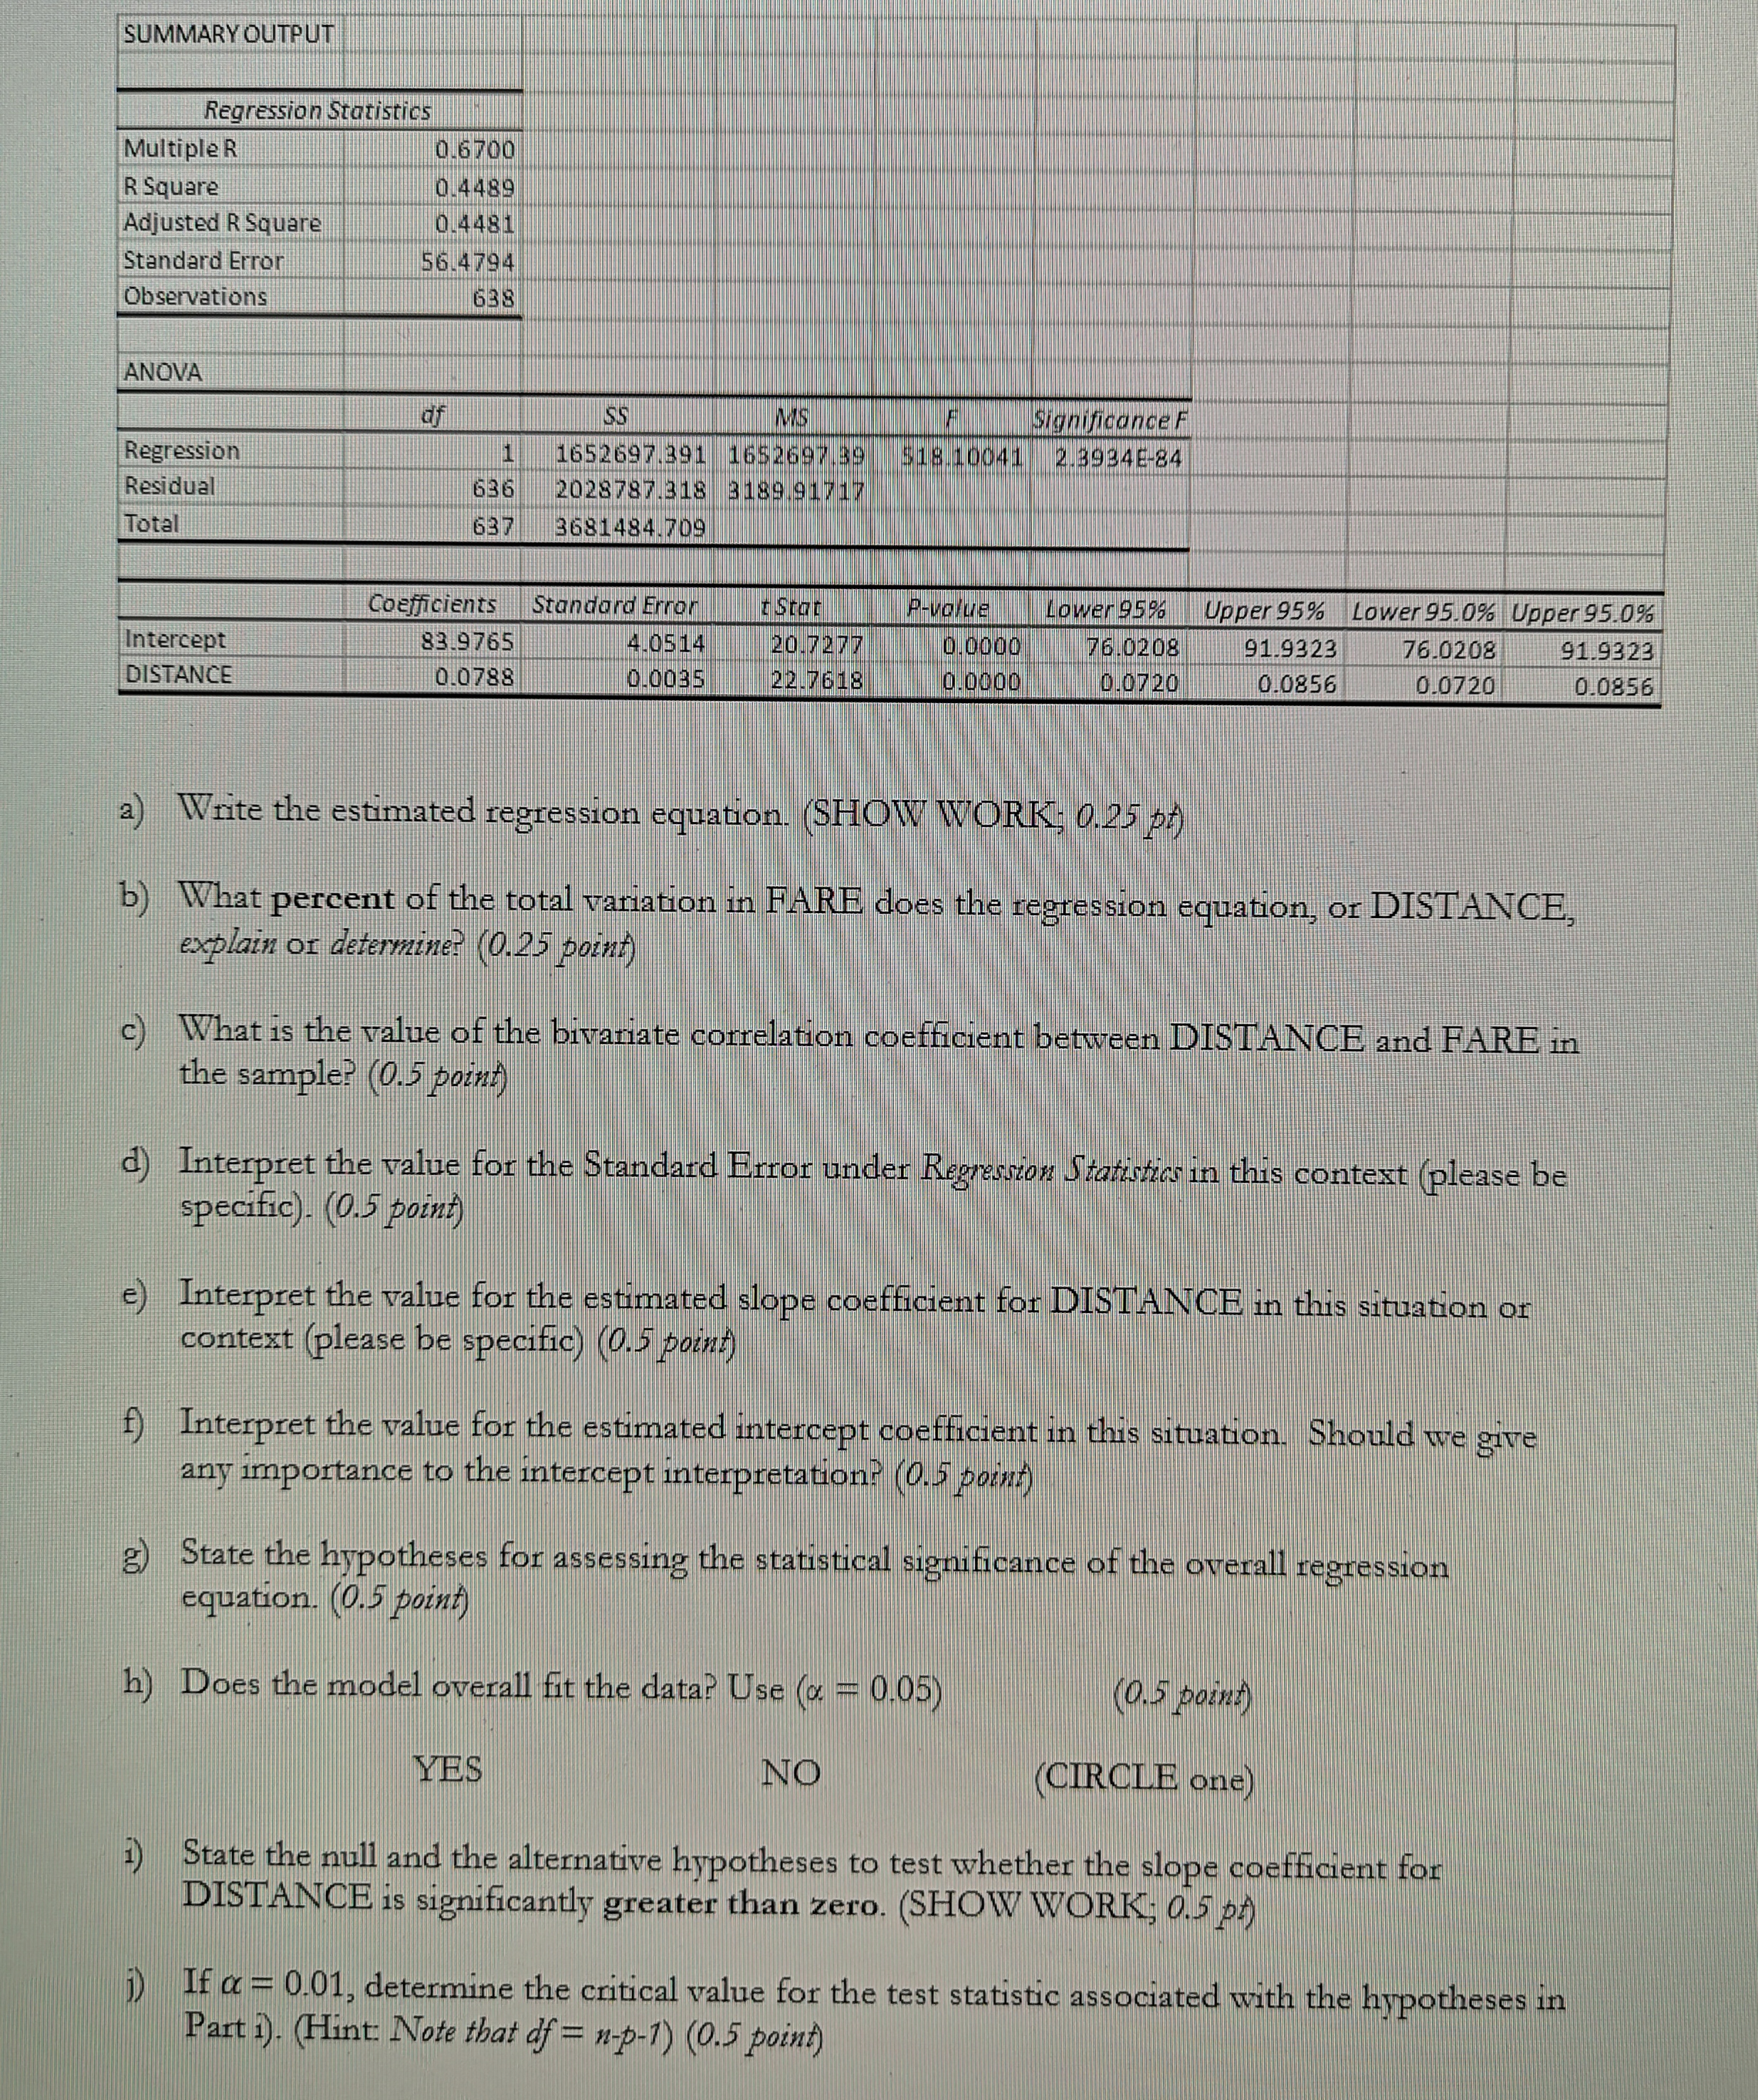
SUMMARY OUTPUT Regression Statistics Multiple R 0.6700 R Square 0.4489 Adjusted R Square 0.4481 Standard Error 56.4794 Observations 638 ANOVA MS Significance F Regression 1


Step by Step Solution
There are 3 Steps involved in it
Step: 1

Get Instant Access to Expert-Tailored Solutions
See step-by-step solutions with expert insights and AI powered tools for academic success
Step: 2

Step: 3
Ace Your Homework with AI
Get the answers you need in no time with our AI-driven, step-by-step assistance
Get Started
Combinatorial Geometry In The Plane
Authors: Hugo Hadwiger, Hans Debrunner, Victor Klee
1st Edition
048679993X, 9780486799933