

Answered step by step
Verified Expert Solution
Question
1 Approved Answer
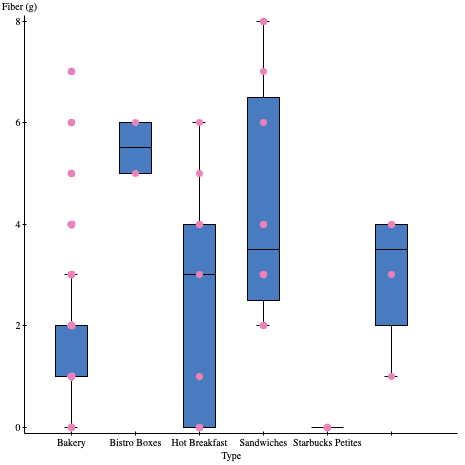
Summary statistics: Column n Mean Variance Std. dev. Std. err. Median Range Min Max Q1 Q3 Fiber (g) 99 2.3232323 3.302618 1.8173107 0.18264659 2 8
Summary statistics:
| Column | n | Mean | Variance | Std. dev. | Std. err. | Median | Range | Min | Max | Q1 | Q3 |
|---|---|---|---|---|---|---|---|---|---|---|---|
| Fiber (g) | 99 | 2.3232323 | 3.302618 | 1.8173107 | 0.18264659 | 2 | 8 | 0 | 8 | 1 | 3 |
Step by Step Solution
There are 3 Steps involved in it
Step: 1

Get Instant Access to Expert-Tailored Solutions
See step-by-step solutions with expert insights and AI powered tools for academic success
Step: 2

Step: 3
Ace Your Homework with AI
Get the answers you need in no time with our AI-driven, step-by-step assistance
Get Started
Understanding Financial Statements
Authors: Lyn FraserAlexa Fox, Judy Strauss, William Briggs, Mario Triola, S Certo, S. Certo, Philip Kotler, Robert Anthony, Barry Monk, Jaan Kiusalaas, R.C. Hi
10th Edition
0132655063, 9780132655064