

Question
Supply Chain Design with Linear Programming The Darby LLC manufactures and distributes meters used to measure electric power consumption. The company started with a small
Supply Chain Design with Linear Programming The Darby LLC manufactures and distributes meters used to measure electric power consumption. The company started with a small production plant in El Paso and gradually built a customer base throughout Texas. A distribution center was established in Fort Worth, Texas, and later, as business expanded, a second distribution center was established in Santa Fe, New Mexico.
The El Paso plant was expanded when the company began marketing its meters in Arizona, California, Nevada, and Utah. With the growth of the West Coast business, the Darby Company opened a third distribution center in Las Vegas and just two years ago opened a second production plant in San Bernardino, California. Manufacturing costs differ between the companys production plants. The cost of each meter produced at the El Paso plant is $10.50. The San Bernardino plant utilizes newer and more efficient equipment; as a result, manufacturing costs are $0.50 per meter less than at the El Paso plant.
Due to the companys rapid growth, not much attention had been paid to the efficiency of its supply chain, but Darbys management decided that it is time to address this issue. The cost of shipping a meter from each of the two plants to each of the three distribution centers is shown in Table A.
| plant | fort worth | santa fe | las vegas |
| el paso | 3.20 | 2.20 | 4.20 |
| san bernardino | 3.90 | 1.20 |
The quarterly production capacity is 30,000 meters at the older El Paso plant and 20,000 meters at the San Bernardino plant. Note that no shipments are allowed from the San Bernardino plant to the Fort Worth distribution center. The company serves nine customer zones from the three distribution centers. The forecast of the number of meters needed in each customer zone for the next quarter is shown in Table B.
| customer zone | demand (meters) |
| dallas | 6300 |
| san antonio | 4880 |
| wichita | 2130 |
| kansas city | 1210 |
| denver | 6120 |
| salt lake city | 4830 |
| phoenix | 2750 |
| Los angeles | 8580 |
| San diego | 4460 |
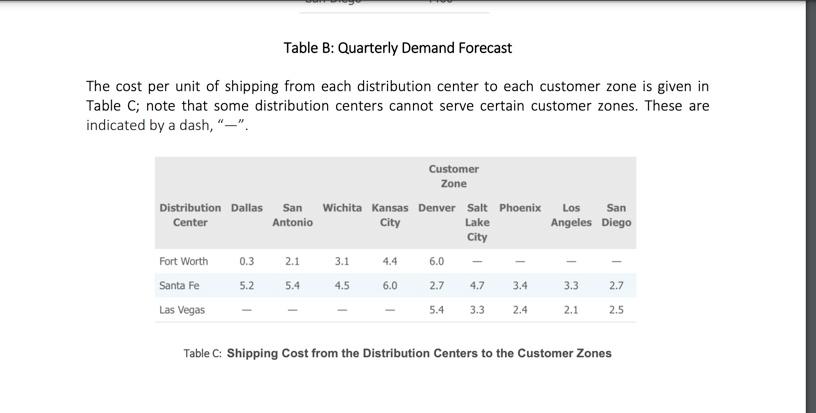
The cost per unit of shipping from each distribution center to each customer zone is given in Table C; note that some distribution centers cannot serve certain customer zones. These are indicated by a dash, .
In its current supply chain, demand at the Dallas, San Antonio, Wichita, and Kansas City customer zones is satisfied by shipments from the Fort Worth distribution center. In a similar manner, the Denver, Salt Lake City, and Phoenix customer zones are served by the Santa Fe distribution center, and the Los Angeles and San Diego customer zones are served by the Las Vegas distribution center. To determine how many units to ship from each plant, the quarterly customer demand forecasts are aggregated at the distribution centers, and a transportation model is used to minimize the cost of shipping from the production plants to the distribution centers.
Managerial Report (Please prepare a report with a Word file) You are hired to make recommendations for improving Darby LLCs supply chain. Your report should address, but not be limited to, the following issues:
1. Please try your best to draw the Supply Chain diagram to show the network of plants, DCs and Customer zones. In the diagram, please label the shipping cost per unit, production capacity and demand size of each customer zone.
2. If the company does not change its current supply chain, what will its lowest distribution costs be for the following quarter? Please draw a diagram to show the optimal solution and label your solution on the diagram.
Table B: Quarterly Demand Forecast The cost per unit of shipping from each distribution center to each customer zone is given in Table C; note that some distribution centers cannot serve certain customer zones. These are indicated by a dash, "-". Customer Zone San Wichita Kansas Denver Salt Phoenix Los San Antonio City Lake Angeles Diego Distribution Dallas Center City 0.3 2.1 3.1 4.4 6.0 1 Fort Worth Santa Fe Las Vegas 5.2 5.4 4.5 6.0 2.7 4.7 3.4 3.3 2.7 - - 5.4 3.3 2.4 2.1 2.5 1 Table C: Shipping Cost from the Distribution Centers to the Customer Zones Table B: Quarterly Demand Forecast The cost per unit of shipping from each distribution center to each customer zone is given in Table C; note that some distribution centers cannot serve certain customer zones. These are indicated by a dash, "-". Customer Zone San Wichita Kansas Denver Salt Phoenix Los San Antonio City Lake Angeles Diego Distribution Dallas Center City 0.3 2.1 3.1 4.4 6.0 1 Fort Worth Santa Fe Las Vegas 5.2 5.4 4.5 6.0 2.7 4.7 3.4 3.3 2.7 - - 5.4 3.3 2.4 2.1 2.5 1 Table C: Shipping Cost from the Distribution Centers to the Customer ZonesStep by Step Solution
There are 3 Steps involved in it
Step: 1

Get Instant Access to Expert-Tailored Solutions
See step-by-step solutions with expert insights and AI powered tools for academic success
Step: 2

Step: 3
Ace Your Homework with AI
Get the answers you need in no time with our AI-driven, step-by-step assistance
Get Started
The Financial Crisis Implications For Research And Teaching
Authors: Ted Azarmi, Wolfgang Amann
1st Edition
3319205870, 978-3319205878