Answered step by step
Verified Expert Solution
Link Copied!

Question

1 Approved Answer

Suppose GDP per capita is given by the following function: 2. Suppose GDP per capita is given by y = Akz, where A is productivity

Suppose GDP per capita is given by the following function:
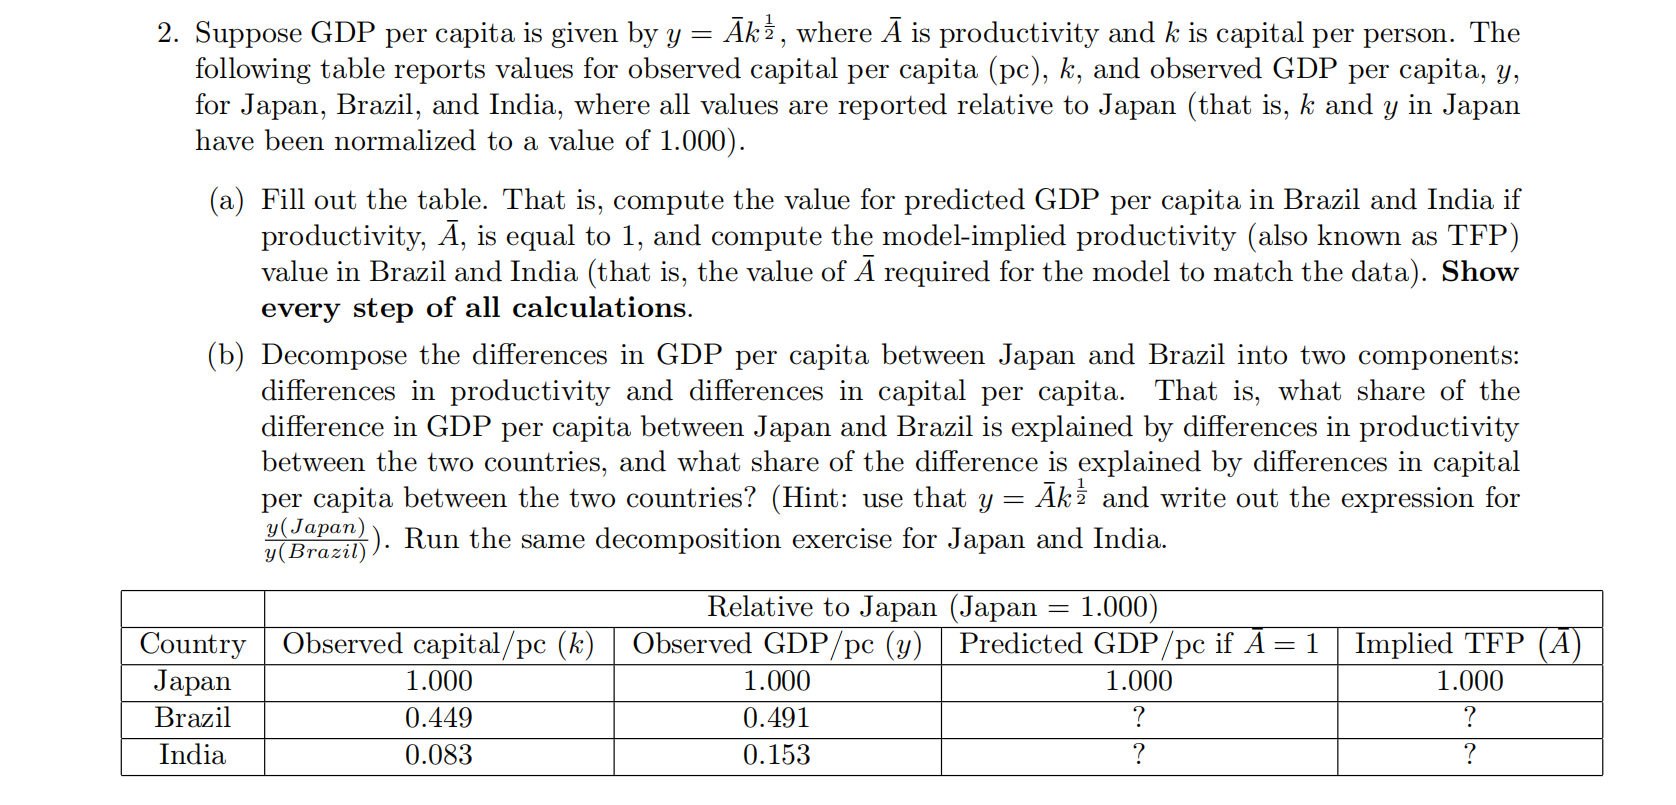
image text in transcribed
2. Suppose GDP per capita is given by y = Akz, where A is productivity and k is capital per person. The following table reports values for observed capital per capita (pc), k, and observed GDP per capita, y, for Japan, Brazil, and India, where all values are reported relative to Japan (that is, k and y in Japan have been normalized to a value of 1.000). (a) Fill out the table. That is, compute the value for predicted GDP per capita in Brazil and India if productivity, A, is equal to 1, and compute the model-implied productivity (also known as TFP) value in Brazil and India (that is, the value of A required for the model to match the data). Show every step of all calculations. (b) Decompose the differences in GDP per capita between Japan and Brazil into two components: differences in productivity and differences in capital per capita. That is, what share of the difference in GDP per capita between Japan and Brazil is explained by differences in productivity between the two countries, and what share of the difference is explained by differences in capital per capita between the two countries? (Hint: use that y = Ak and write out the expression for y(Japan) y(Brazil) ). Run the same decomposition exercise for Japan and India. Relative to Japan (Japan = 1.000) Country Observed capital/pc (k) Observed GDP/pc (y) Predicted GDP /pc if A = 1 Implied TFP A Japan 1.000 1.000 1.000 1.000 Brazil 0.449 0.491 ? India 0.083 0.153

Step by Step Solution

There are 3 Steps involved in it

Step: 1

blur-text-image

Get Instant Access to Expert-Tailored Solutions

See step-by-step solutions with expert insights and AI powered tools for academic success

Step: 2

blur-text-image

Step: 3

blur-text-image

Ace Your Homework with AI

Get the answers you need in no time with our AI-driven, step-by-step assistance

Get Started

Recommended Textbook for

Managerial Economics A Problem-Solving Approach

Authors: Luke M. Froeb, Brain T. Mccann

2nd Edition

B00BTM8FK0

More Books

Students also viewed these Economics questions

Question

using signal flow graph

Answered: 1 week ago