

Suppose Sam runs a small business that manufactures shirts. Assume that the market for shirts is a
Question:
Suppose Sam runs a small business that manufactures shirts. Assume that the market for shirts is a price-taker market, and the market price is $10 per shirt.
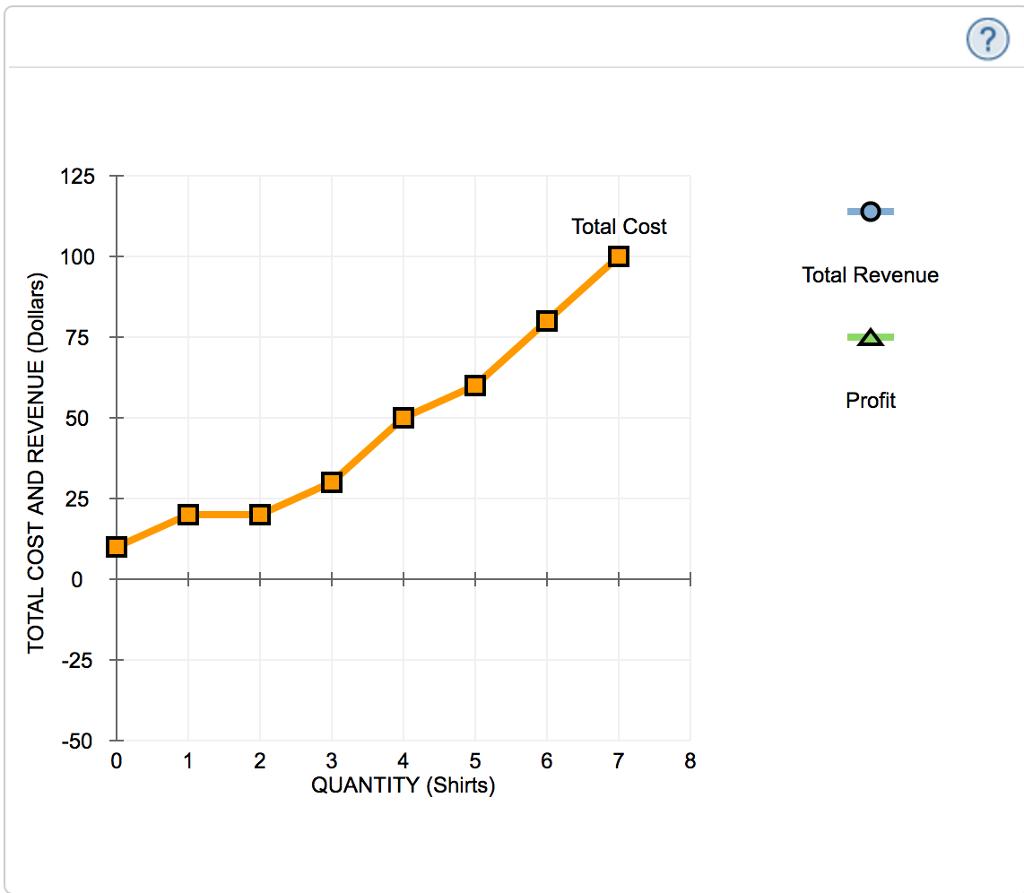
The following graph shows Sam's total cost curve.
Use the blue points (circle symbol) to plot total revenue, and the green points (triangle symbol) to plot profit for the first seven shirts that Sam produces, including zero shirts.
(0,10)
(1,20)
(2,20)
(3,30)
(4,50)
(5,60)
(6,80)
(7,100)
Calculate Sam's marginal revenue and marginal cost for the first seven shirts he produces, and plot them on the following graph. Use the blue points (circle symbol) to plot marginal revenue and the orange points (square symbol) to plot marginal cost.
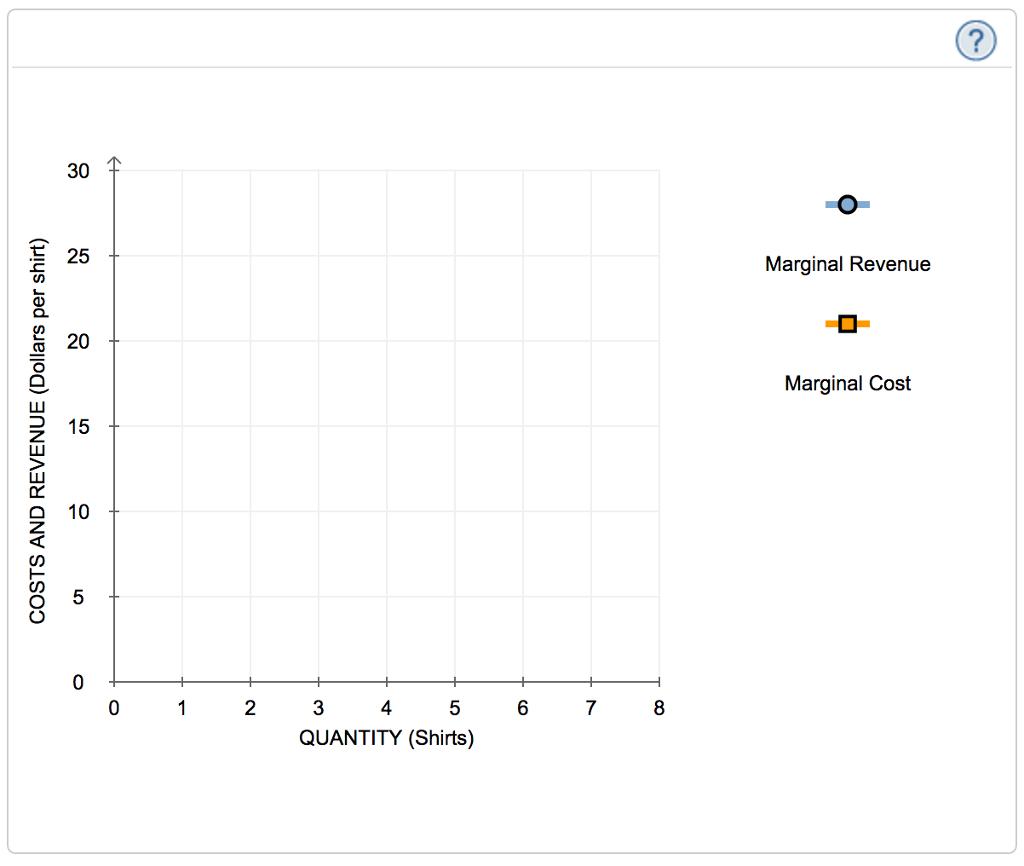
Sam's profit is maximized when he produces _______ shirts. When he does this, the marginal cost of the last shirt he produces is $_____, which is (Greater/Less) than the price Sam receives for each shirt he sells. The marginal cost of producing an additional shirt (that is, one more shirt than would maximize his profit) is $_____, which is (Greater/Less) than the price Sam receives for each shirt he sells. Therefore, Sam's profit-maximizing quantity corresponds to the intersection of the (Total cost & Total revenue, Marginal cost & Total revenue, Total revenue and profit, marginal cost and marginal revenue, total cost and profit, total cost and marginal revenue.) curves. Because Sam is a price taker, this last condition can also be written as (TC=TR, PROFIT = TR - TC, MC = TR, PROFIT = MR - MC, P = MC
Expert Answer:
Total revenues are the total amount of money earned by a firm from the sale of its entire output qua... View the full answer


Horngrens Financial and Managerial Accounting
ISBN: 978-0133866292
5th edition
Authors: Tracie L. Nobles, Brenda L. Mattison, Ella Mae Matsumura
