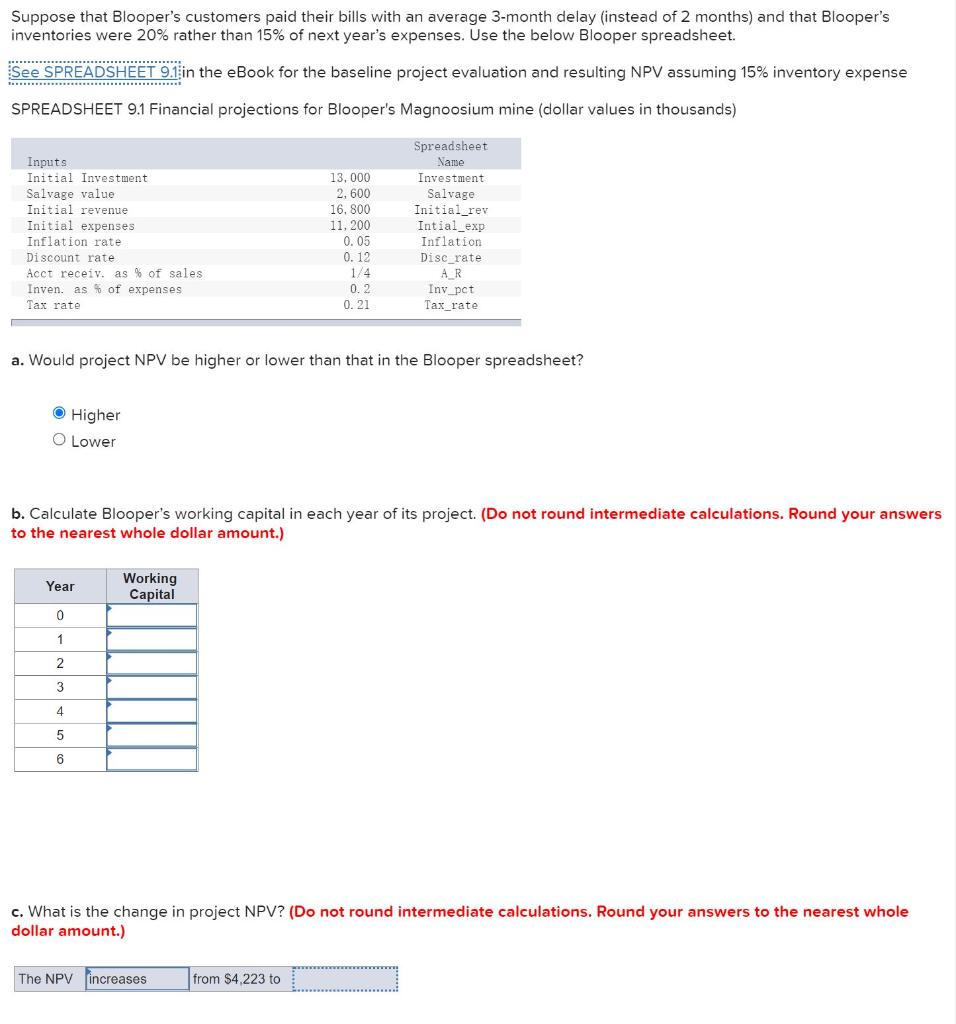
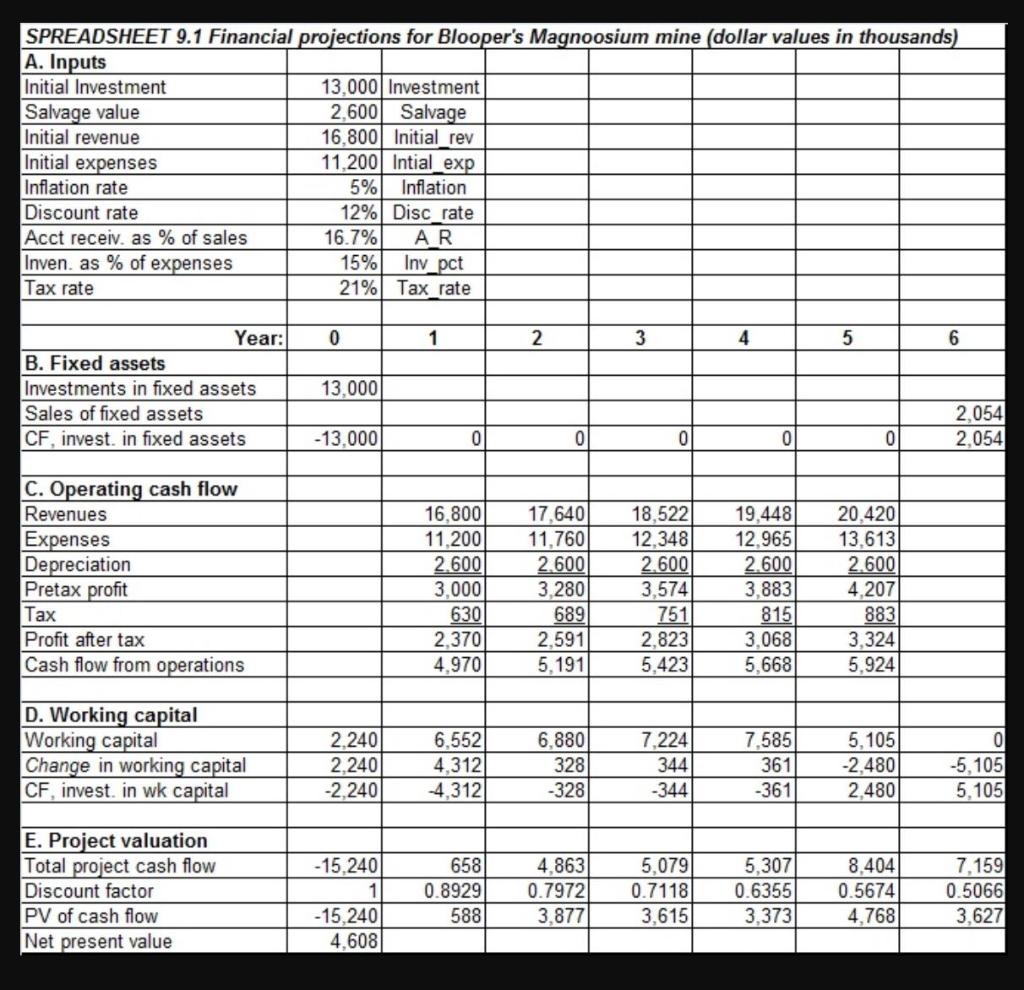
Suppose that Blooper's customers paid their bills with an average 3-month delay (instead of 2 months) and that Blooper's inventories were 20% rather than 15% of next year's expenses. Use the below Blooper spreadsheet. See SPREADSHEET 9.1 in the eBook for the baseline project evaluation and resulting NPV assuming 15% inventory expense SPREADSHEET 9.1 Financial projections for Blooper's Magnoosium mine (dollar values in thousands) Spreadsheet Name Investment Inputs Initial Investment Salvage value Initial revenue Initial expenses Inflation rate Discount rate Acct receiv. as % of sales Inven. as % of expenses Tax rate Salvage Initial_rev Intial_exp 13,000 2.600 16.800 11,200 0.05 0.12 1/4 0.2 0.21 Inflation Disc_rate AR Inv_pot Tax_rate a. Would project NPV be higher or lower than that in the Blooper spreadsheet? Higher O Lower b. Calculate Blooper's working capital in each year of its project. (Do not round intermediate calculations. Round your answers to the nearest whole dollar amount.) Year Working Capital 0 1 2 T 3 4 5 6 c. What is the change in project NPV? (Do not round intermediate calculations. Round your answers to the nearest whole dollar amount.) The NPV increases from $4,223 to SPREADSHEET 9.1 Financial projections for Blooper's Magnoosium mine (dollar values in thousands) A. Inputs Initial Investment 13,000 Investment Salvage value 2,600 Salvage Initial revenue 16.800 Initial rev Initial expenses 11.200 Intial exp Inflation rate 5% Inflation Discount rate 12% Disc rate Acct receiv, as % of sales 16.7% AR Inven, as % of expenses 15% Iny pct Tax rate 21% Tax_rate 0 1 2 3 4 5 6 Year: B. Fixed assets Investments in fixed assets Sales of fixed assets CF, invest. in fixed assets 13,000 2,054 2,054 -13,000 0 0 0 0 0 C. Operating cash flow Revenues Expenses Depreciation Pretax profit Tax Profit after tax Cash flow from operations 16,800 11.200 2.600 3.000 630 2,370 4.970 17,640 11,760 2.600 3.280 689 2,591 5.191 18,522 12,348 2.600 3.574 751 2,823 5,423 19,448 12.965 2.600 3,883 815 3.068 5.668 20.420 13,613 2.600 4.207 883 3,324 5,924 7,585 D. Working capital Working capital Change in working capital CF, invest in wk capital 2.240 2.240 -2.240 6,552 4,312 4.312 6,880 328 -328 7,224 344 -344 361 5,105 -2.480 2.480 0 -5,105 5,105 -361 E. Project valuation Total project cash flow Discount factor PV of cash flow Net present value - 15,240 1 -15,240 4,608 658 0.8929 588 4,863 0.7972 3,877 5,079 0.7118 3,615 5,307 0.6355 3,373 8,404 0.5674 4,768 7,159 0.5066 3,627 Suppose that Blooper's customers paid their bills with an average 3-month delay (instead of 2 months) and that Blooper's inventories were 20% rather than 15% of next year's expenses. Use the below Blooper spreadsheet. See SPREADSHEET 9.1 in the eBook for the baseline project evaluation and resulting NPV assuming 15% inventory expense SPREADSHEET 9.1 Financial projections for Blooper's Magnoosium mine (dollar values in thousands) Spreadsheet Name Investment Inputs Initial Investment Salvage value Initial revenue Initial expenses Inflation rate Discount rate Acct receiv. as % of sales Inven. as % of expenses Tax rate Salvage Initial_rev Intial_exp 13,000 2.600 16.800 11,200 0.05 0.12 1/4 0.2 0.21 Inflation Disc_rate AR Inv_pot Tax_rate a. Would project NPV be higher or lower than that in the Blooper spreadsheet? Higher O Lower b. Calculate Blooper's working capital in each year of its project. (Do not round intermediate calculations. Round your answers to the nearest whole dollar amount.) Year Working Capital 0 1 2 T 3 4 5 6 c. What is the change in project NPV? (Do not round intermediate calculations. Round your answers to the nearest whole dollar amount.) The NPV increases from $4,223 to SPREADSHEET 9.1 Financial projections for Blooper's Magnoosium mine (dollar values in thousands) A. Inputs Initial Investment 13,000 Investment Salvage value 2,600 Salvage Initial revenue 16.800 Initial rev Initial expenses 11.200 Intial exp Inflation rate 5% Inflation Discount rate 12% Disc rate Acct receiv, as % of sales 16.7% AR Inven, as % of expenses 15% Iny pct Tax rate 21% Tax_rate 0 1 2 3 4 5 6 Year: B. Fixed assets Investments in fixed assets Sales of fixed assets CF, invest. in fixed assets 13,000 2,054 2,054 -13,000 0 0 0 0 0 C. Operating cash flow Revenues Expenses Depreciation Pretax profit Tax Profit after tax Cash flow from operations 16,800 11.200 2.600 3.000 630 2,370 4.970 17,640 11,760 2.600 3.280 689 2,591 5.191 18,522 12,348 2.600 3.574 751 2,823 5,423 19,448 12.965 2.600 3,883 815 3.068 5.668 20.420 13,613 2.600 4.207 883 3,324 5,924 7,585 D. Working capital Working capital Change in working capital CF, invest in wk capital 2.240 2.240 -2.240 6,552 4,312 4.312 6,880 328 -328 7,224 344 -344 361 5,105 -2.480 2.480 0 -5,105 5,105 -361 E. Project valuation Total project cash flow Discount factor PV of cash flow Net present value - 15,240 1 -15,240 4,608 658 0.8929 588 4,863 0.7972 3,877 5,079 0.7118 3,615 5,307 0.6355 3,373 8,404 0.5674 4,768 7,159 0.5066 3,627