Answered step by step
Verified Expert Solution
Link Copied!

Question

1 Approved Answer

Suppose that in January 2006 Kenneth Cole Productions had sales of $522 million, EBITDA of $59.6 million, excess cash of $99 million, $4.3 million of
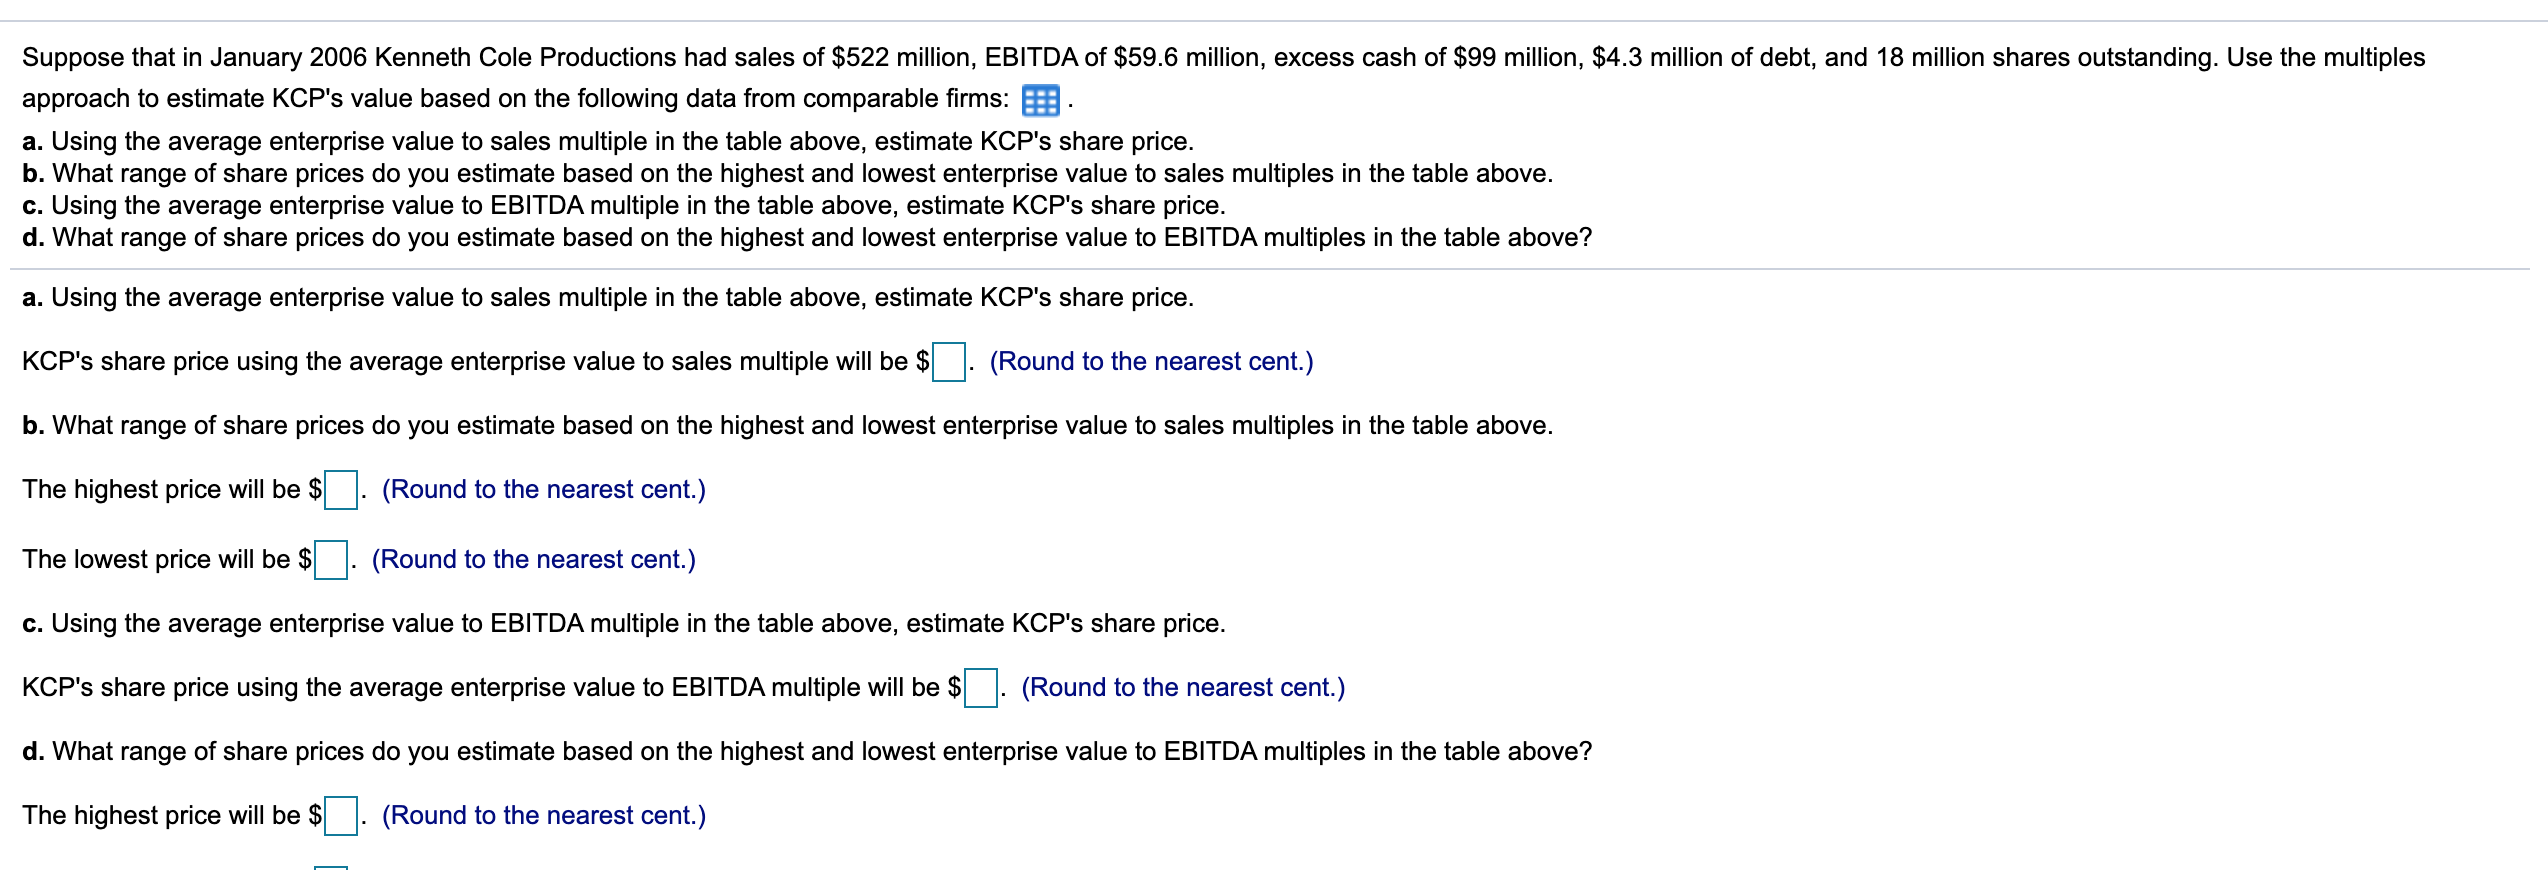
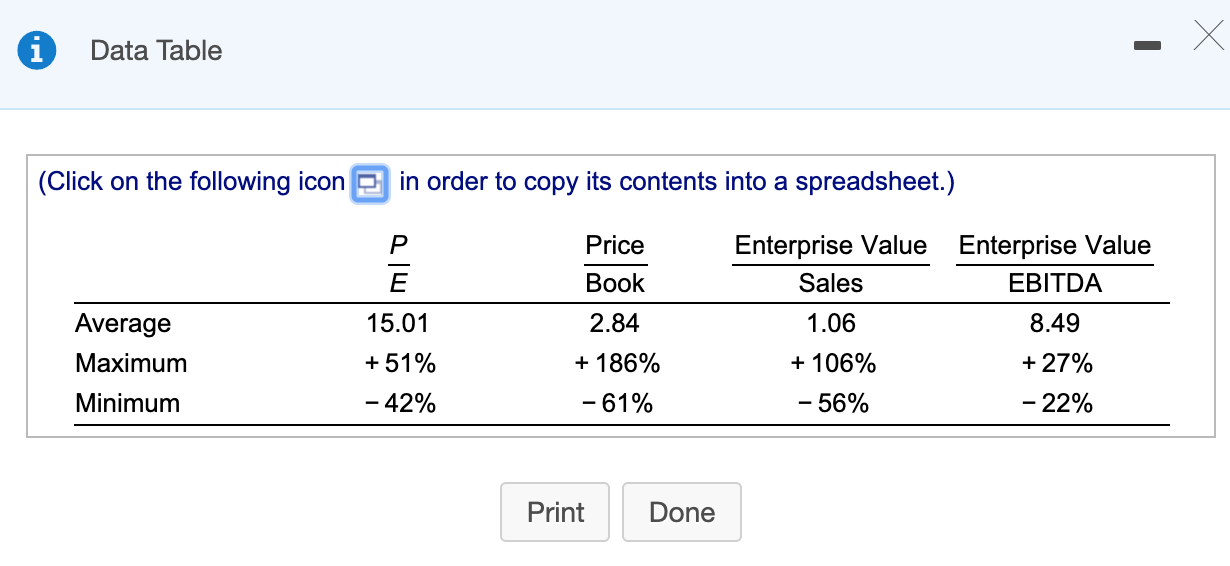
image text in transcribedimage text in transcribed

Suppose that in January 2006 Kenneth Cole Productions had sales of $522 million, EBITDA of $59.6 million, excess cash of $99 million, $4.3 million of debt, and 18 million shares outstanding. Use the multipless approach to estimate KCP's value based on the following data from comparable firms: a. Using the average enterprise value to sales multiple in the table above, estimate KCP's share price. b. What range of share prices do you estimate based on the highest and lowest enterprise value to sales multiples in the table above. c. Using the average enterprise value to EBITDA multiple in the table above, estimate KCP's share price. d. What range of share prices do you estimate based on the highest and lowest enterprise value to EBITDA multiples in the table above? a. Using the average enterprise value to sales multiple in the table above, estimate KCP's share price. KCP's share price using the average enterprise value to sales multiple will be $ (Round to the nearest cent.) b. What range of share prices do you estimate based on the highest and lowest enterprise value to sales multiples in the table above The highest price will be $ (Round to the nearest cent.) The lowest price will be $ (Round to the nearest cent.) c. Using the average enterprise value to EBITDA multiple in the table above, estimate KCP's share price. KCP's share price using the average enterprise value to EBITDA multiple will be $ (Round to the nearest cent.) d. What range of share prices do you estimate based on the highest and lowest enterprise value to EBITDA multiples in the table above? The highest price will be $ (Round to the nearest cent.) i Data Table (Click on the following icon in order to copy its contents into a spreadsheet.) P Price Enterprise Value Enterprise Value ook Sales EBITDA Average 15.01 2.84 1.06 8.49 186% 27% Maximum 51% 106% -61% - 56% Minimum - 42% - 22% Done Print

Step by Step Solution

There are 3 Steps involved in it

Step: 1

blur-text-image

Get Instant Access to Expert-Tailored Solutions

See step-by-step solutions with expert insights and AI powered tools for academic success

Step: 2

blur-text-image

Step: 3

blur-text-image

Ace Your Homework with AI

Get the answers you need in no time with our AI-driven, step-by-step assistance

Get Started

Recommended Textbook for

The Emerald Handbook On Cryptoassets Investment Opportunities And Challenges

Authors: H. Kent Baker, Hugo Benedetti, Ehsan Nikbakht, Sean Stein Smith

1st Edition

1804553212, 978-1804553213

More Books

Students also viewed these Finance questions

Question

x > -3 Sketch the graph of the given inequality.

Answered: 1 week ago