

Question
Suppose that sales growth from 2020 to 2021is 14%andthat:1.cash dividends and repurchases grow at that rate; 2.all income statement items grow at that rate;3.all assets
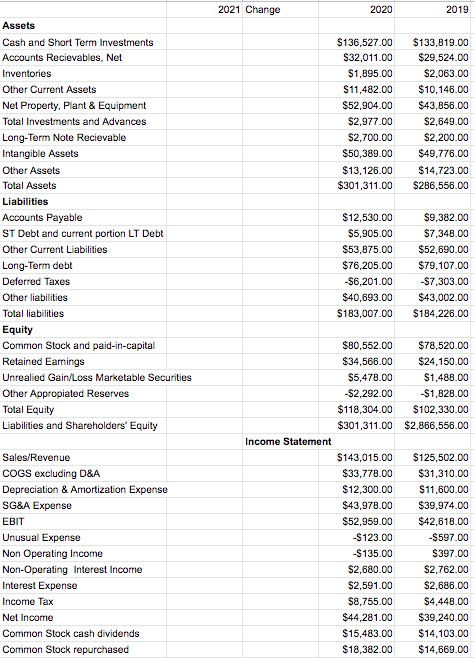
Suppose that sales growth from 2020 to 2021is 14%andthat:1.cash dividends and repurchases grow at that rate; 2.all income statement items grow at that rate;3.all assets on the balance sheet grow at that rate;4.accountspayable grow at that rate, but all other liabilities and shareholder equity items (except short-and long-term debt and retained earnings) stay constant (i.e., dont change from 2020 to 2021);and5. Microsoft aims to maintain the 2020 quick ratio 2021.
calculate long-term debt as a plug that makes A = L + SE
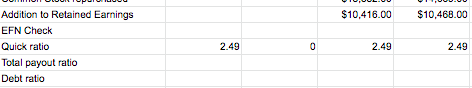
oTodo this, create a new row called EFN that contains a formula = total assets total liabilities total equity. This value should be the plug. Enter that value into the change column of long-term debt and show that EFN is now equal to zero. Be careful. Make sure that your total liabilities and total equity cells use formulas that sum the appropriate elements of your pro forma financial statement(i.e., do now assume that they grow at 14%!!).
2021 Change 2020 2019 $136,527.00 $32,011.00 $1,895.00 $11,482.00 $52,904.00 $2,977.00 $2,700.00 $50,389.00 $13,126.00 $301,311.00 $133,819.00 $29,524.00 $2,063.00 $10,146.00 $43,856.00 $2,649.00 $2,200.00 $49,776.00 $14,723.00 $286,556.00 Assets Cash and Short Term Investments Accounts Recievables, Net Inventories Other Current Assets Net Property, Plant & Equipment Total Investments and Advances Long-Term Note Recievable Intangible Assets Other Assets Total Assets Liabilities Accounts Payable ST Debt and current portion LT Debt Other Current Liabilities Long-Term debt Deferred Taxes Other liabilities Total liabilities Equity Common Stock and paid-in-capital Retained Earnings Unrealied Gain/Loss Marketable Securities Other Appropiated Reserves Total Equity Liabilities and Shareholders' Equity $12,530.00 $5,905.00 $53,875.00 $76,205.00 $6,201.00 $40,693.00 $183,007.00 $9,382.00 $7,348.00 $52,690.00 $79,107.00 -$7,303.00 $43,002.00 $184,226.00 $80,552.00 $78,520.00 $34,566.00 $24,150.00 $5,478.00 $1,488.00 $2,292.00 $1,828.00 $118,304.00 $102,330.00 $301,311.00 $2,866,556.00 Income Statement Sales/Revenue COGS excluding D&A Depreciation & Amortization Expense SG&A Expense EBIT Unusual Expense Non Operating Income Non-Operating Interest Income Interest Expense Income Tax Net Income Common Stock cash dividends Common Stock repurchased $143,015.00 $33,778.00 $12,300.00 $43,978.00 $52,959.00 -$123.00 -$135.00 $2,680.00 $2,591.00 $8,755.00 $44,281.00 $15,483.00 $18,382.00 $125,502.00 $31,310.00 $11,600.00 $39,974.00 $42,618.00 -$597.00 $397.00 $2,762.00 $2,686.00 $4,448.00 $39,240.00 $14,103.00 $14,669.00 $10,416.00 $10,468.00 Addition to Retained Earnings EFN Check Quick ratio Total payout ratio Debt ratio 2.49 0 2.49 2.49 2021 Change 2020 2019 $136,527.00 $32,011.00 $1,895.00 $11,482.00 $52,904.00 $2,977.00 $2,700.00 $50,389.00 $13,126.00 $301,311.00 $133,819.00 $29,524.00 $2,063.00 $10,146.00 $43,856.00 $2,649.00 $2,200.00 $49,776.00 $14,723.00 $286,556.00 Assets Cash and Short Term Investments Accounts Recievables, Net Inventories Other Current Assets Net Property, Plant & Equipment Total Investments and Advances Long-Term Note Recievable Intangible Assets Other Assets Total Assets Liabilities Accounts Payable ST Debt and current portion LT Debt Other Current Liabilities Long-Term debt Deferred Taxes Other liabilities Total liabilities Equity Common Stock and paid-in-capital Retained Earnings Unrealied Gain/Loss Marketable Securities Other Appropiated Reserves Total Equity Liabilities and Shareholders' Equity $12,530.00 $5,905.00 $53,875.00 $76,205.00 $6,201.00 $40,693.00 $183,007.00 $9,382.00 $7,348.00 $52,690.00 $79,107.00 -$7,303.00 $43,002.00 $184,226.00 $80,552.00 $78,520.00 $34,566.00 $24,150.00 $5,478.00 $1,488.00 $2,292.00 $1,828.00 $118,304.00 $102,330.00 $301,311.00 $2,866,556.00 Income Statement Sales/Revenue COGS excluding D&A Depreciation & Amortization Expense SG&A Expense EBIT Unusual Expense Non Operating Income Non-Operating Interest Income Interest Expense Income Tax Net Income Common Stock cash dividends Common Stock repurchased $143,015.00 $33,778.00 $12,300.00 $43,978.00 $52,959.00 -$123.00 -$135.00 $2,680.00 $2,591.00 $8,755.00 $44,281.00 $15,483.00 $18,382.00 $125,502.00 $31,310.00 $11,600.00 $39,974.00 $42,618.00 -$597.00 $397.00 $2,762.00 $2,686.00 $4,448.00 $39,240.00 $14,103.00 $14,669.00 $10,416.00 $10,468.00 Addition to Retained Earnings EFN Check Quick ratio Total payout ratio Debt ratio 2.49 0 2.49 2.49Step by Step Solution
There are 3 Steps involved in it
Step: 1

Get Instant Access to Expert-Tailored Solutions
See step-by-step solutions with expert insights and AI powered tools for academic success
Step: 2

Step: 3
Ace Your Homework with AI
Get the answers you need in no time with our AI-driven, step-by-step assistance
Get Started
Mastering Islamic Finance
Authors: Faizal Karbani
1st Edition
1292001445, 978-1292001449