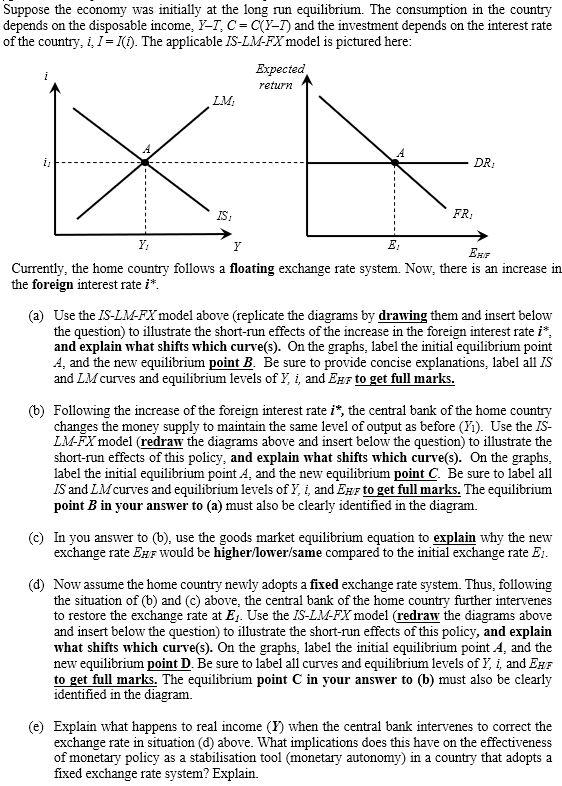
Suppose the economy was initially at the long run equilibrium. The consumption in the country depends on the disposable income. Y-T, C=C(Y-1) and the investment depends on the interest rate of the country, i. I=7(1). The applicable IS-LM-FX model is pictured here: Expected return LM: * i: DR IS FR: Y Y: E EHF Currently, the home country follows a floating exchange rate system. Now, there is an increase in the foreign interest rate i*. (a) Use the IS-LM-FX model above (replicate the diagrams by drawing them and insert below the question) to illustrate the short-run effects of the increase in the foreign interest rate is and explain what shifts which curve(s). On the graphs, label the initial equilibrium point 4, and the new equilibrium point B. Be sure to provide concise explanations, label all IS and LM curves and equilibrium levels of Y, i, and EHF to get full marks. (b) Following the increase of the foreign interest rate i*, the central bank of the home country changes the money supply to maintain the same level of output as before (Yl). Use the IS- LM-X model (redraw the diagrams above and insert below the question) to illustrate the short-run effects of this policy, and explain what shifts which curve(s). On the graphs. label the initial equilibrium point A, and the new equilibrium point C. Be sure to labei all IS and LM curves and equilibrium levels of Y, i and Enr to get full marks. The equilibrium point B in your answer to (a) must also be clearly identified in the diagram. ) In you answer to (b), use the goods market equilibrium equation to explain why the new exchange rate EHF would be higher/lower/same compared to the initial exchange rate E. (d) Now assume the home country newly adopts a fixed exchange rate system. Thus, following the situation of (t) and (c) above, the central bank of the home country further intervenes to restore the exchange rate at Ej. Use the IS-LM-FX model (redraw the diagrams above and insert below the question) to illustrate the short-run effects of this policy, and explain what shifts which curve(s). On the graphs, label the initial equilibrium point 4, and the new equilibrium point D. Be sure to label all curves and equilibrium levels of Y, i, and EHF to get full marks. The equilibrium point C in your answer to (b) must also be clearly identified in the diagram (e) Explain what happens to real income (Y) when the central bank intervenes to correct the exchange rate in situation (d) above. What implications does this have on the effectiveness of monetary policy as a stabilisation tool (monetary autonomy) in a country that adopts a fixed exchange rate system? Explain. Suppose the economy was initially at the long run equilibrium. The consumption in the country depends on the disposable income. Y-T, C=C(Y-1) and the investment depends on the interest rate of the country, i. I=7(1). The applicable IS-LM-FX model is pictured here: Expected return LM: * i: DR IS FR: Y Y: E EHF Currently, the home country follows a floating exchange rate system. Now, there is an increase in the foreign interest rate i*. (a) Use the IS-LM-FX model above (replicate the diagrams by drawing them and insert below the question) to illustrate the short-run effects of the increase in the foreign interest rate is and explain what shifts which curve(s). On the graphs, label the initial equilibrium point 4, and the new equilibrium point B. Be sure to provide concise explanations, label all IS and LM curves and equilibrium levels of Y, i, and EHF to get full marks. (b) Following the increase of the foreign interest rate i*, the central bank of the home country changes the money supply to maintain the same level of output as before (Yl). Use the IS- LM-X model (redraw the diagrams above and insert below the question) to illustrate the short-run effects of this policy, and explain what shifts which curve(s). On the graphs. label the initial equilibrium point A, and the new equilibrium point C. Be sure to labei all IS and LM curves and equilibrium levels of Y, i and Enr to get full marks. The equilibrium point B in your answer to (a) must also be clearly identified in the diagram. ) In you answer to (b), use the goods market equilibrium equation to explain why the new exchange rate EHF would be higher/lower/same compared to the initial exchange rate E. (d) Now assume the home country newly adopts a fixed exchange rate system. Thus, following the situation of (t) and (c) above, the central bank of the home country further intervenes to restore the exchange rate at Ej. Use the IS-LM-FX model (redraw the diagrams above and insert below the question) to illustrate the short-run effects of this policy, and explain what shifts which curve(s). On the graphs, label the initial equilibrium point 4, and the new equilibrium point D. Be sure to label all curves and equilibrium levels of Y, i, and EHF to get full marks. The equilibrium point C in your answer to (b) must also be clearly identified in the diagram (e) Explain what happens to real income (Y) when the central bank intervenes to correct the exchange rate in situation (d) above. What implications does this have on the effectiveness of monetary policy as a stabilisation tool (monetary autonomy) in a country that adopts a fixed exchange rate system? Explain


