

Answered step by step
Verified Expert Solution
Question
1 Approved Answer
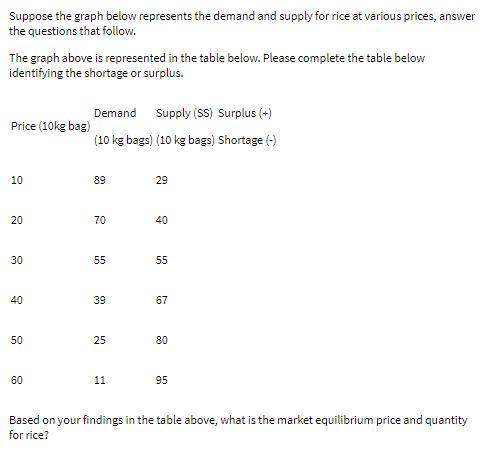
Suppose the graph below represents the demand and supply for rice at various prices, answer the questions that follow. The graph above is represented in
Step by Step Solution
There are 3 Steps involved in it
Step: 1

Get Instant Access to Expert-Tailored Solutions
See step-by-step solutions with expert insights and AI powered tools for academic success
Step: 2

Step: 3
Ace Your Homework with AI
Get the answers you need in no time with our AI-driven, step-by-step assistance
Get Started
Handbook Of Energy Audits
Authors: Prentice-Hall
1st Edition
0881731285, 978-0881731286