

Question
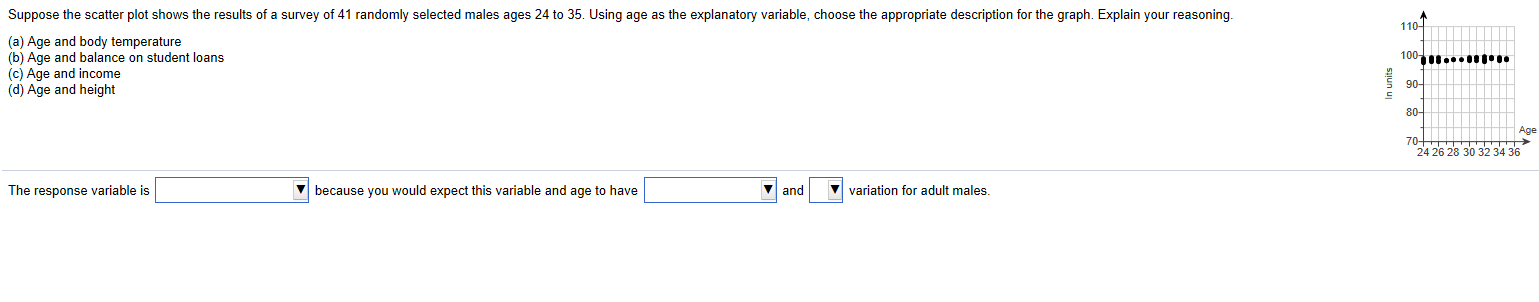
Suppose the scatter plot shows the results of a survey of 41 randomly selected males ages of24 to 35. Using age as the explanatory variable,
Suppose the scatter plot shows the results of a survey of 41 randomly selected males ages of24 to 35. Using age as the explanatory variable, choose the appropriate description for the graph.
Step by Step Solution
There are 3 Steps involved in it
Step: 1

Get Instant Access to Expert-Tailored Solutions
See step-by-step solutions with expert insights and AI powered tools for academic success
Step: 2

Step: 3
Ace Your Homework with AI
Get the answers you need in no time with our AI-driven, step-by-step assistance
Get Started
Algebra 2
Authors: Randall I. Charles, Basia Hall, Dan Kennedy, Laurie E Bass
Student Edition
0133500438, 978-0133500431