Answered step by step
Verified Expert Solution
Question
1 Approved Answer
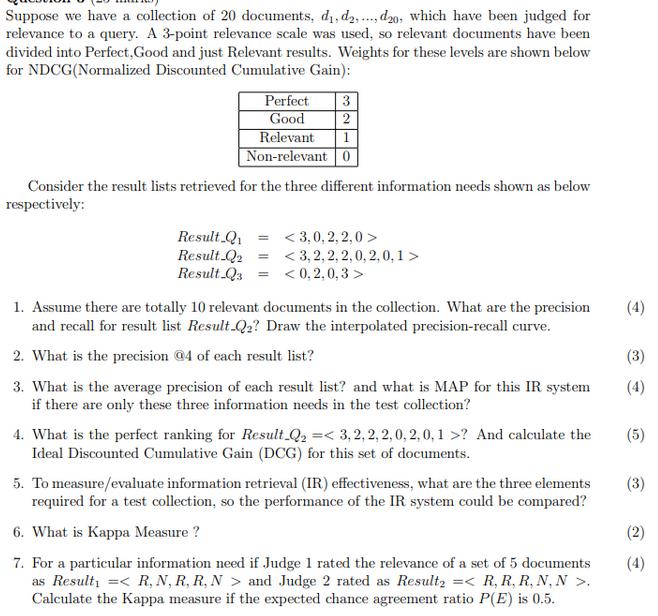
Suppose we have a collection of 20 documents, d, d2,..., d20, which have been judged for relevance to a query. A 3-point relevance scale

Suppose we have a collection of 20 documents, d, d2,..., d20, which have been judged for relevance to a query. A 3-point relevance scale was used, so relevant documents have been divided into Perfect, Good and just Relevant results. Weights for these levels are shown below for NDCG(Normalized Discounted Cumulative Gain): Perfect 3 Good 2 Relevant 1 Non-relevant 0 Consider the result lists retrieved for the three different information needs shown as below respectively: Result Q Result_Q2 Result Q3 = = = < 0,2,0,3> 1. Assume there are totally 10 relevant documents in the collection. What are the precision and recall for result list Result-Q2? Draw the interpolated precision-recall curve. 2. What is the precision @4 of each result list? (4) (3) 3. What is the average precision of each result list? and what is MAP for this IR system if there are only these three information needs in the test collection? (4) 4. What is the perfect ranking for Result Q = < 3,2,2,2,0, 2, 0, 1 >? And calculate the Ideal Discounted Cumulative Gain (DCG) for this set of documents. (5) 5. To measure/evaluate information retrieval (IR) effectiveness, what are the three elements required for a test collection, so the performance of the IR system could be compared? (3) 6. What is Kappa Measure? (2) 7. For a particular information need if Judge 1 rated the relevance of a set of 5 documents as Result = < < R, N, R, R, N > and Judge 2 rated as Result2 = < R, R, R, N, N >. Calculate the Kappa measure if the expected chance agreement ratio P(E) is 0.5. (4)
Step by Step Solution
★★★★★
3.55 Rating (159 Votes )
There are 3 Steps involved in it
Step: 1
Here are the answers to the questions 1 Result Q has 2 Perfect results and 2 Good results out of a t...
Get Instant Access to Expert-Tailored Solutions
See step-by-step solutions with expert insights and AI powered tools for academic success
Step: 2

Step: 3

Ace Your Homework with AI
Get the answers you need in no time with our AI-driven, step-by-step assistance
Get Started


