Question
%% System Parameters Dc = .04445; % Diameter of tank in [m] Do = .0047625; % Diameter of orifice in [m] g = 9.81; %


%% System Parameters Dc = .04445; % Diameter of tank in [m] Do = .0047625; % Diameter of orifice in [m] g = 9.81; % Gravitational acceleration in [m/s^2] Ac = pi*(Dc/2)^2; % Cross-sectional area of tank based on diameter in [m^2] Ao = pi*(Do/2)^2; % Cross-sectional area of orifice based on diameter in [m^2] Kp = 0; % Pump constant in [m^3/s/V] Cd = .5; % Unitless discharge coefficient between 0 and 1 vp = 9; % Pump voltage in [V]
%% Initial Condition h0 = .15; % Initial height of water in the tank in [m]
%% Simulate System sim_time = 120; % Length of simulation in [s] sim Sim_OpenLoop.mdl % Execute simulation
%% Plot Simulation Results figure; % Open a new figure plot(t_sim, h_sim); % plot the simulated hieghts as a function of time ylim([0 h0]) % Set y-axis range xlabel('Time [s]') ylabel('Height [m]')
plot(h1_exp)
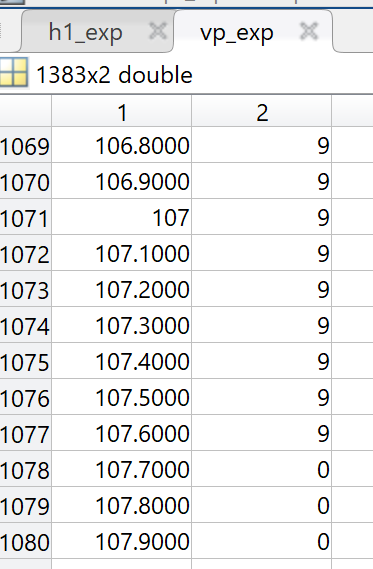
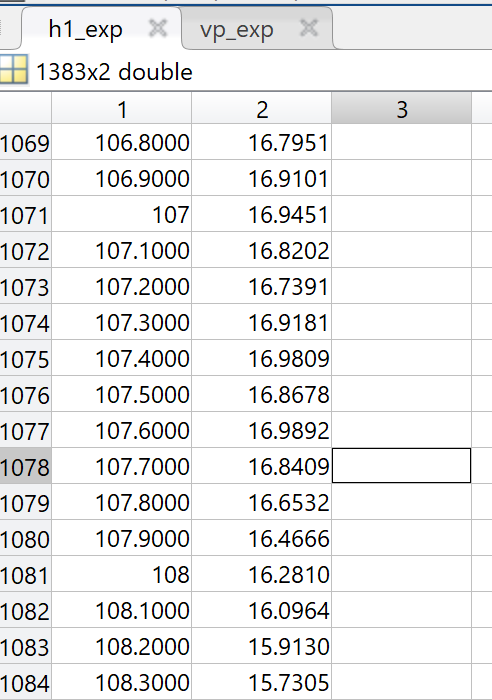
I need a little help... I am stuck on how to plot h1_exp only decreasing values for when vp_exp switches from 9 volts to 0 volts. I posted the columns of the variable information from the simulation, the first column on both is time and the voltage is cut at 107.7 seconds. How would you code this to answer the above statement? I have posted my code so far to help which is in MATLAB.
Using Matlab, plot the data such that the time axis starts at zero at exactly the point where the height of the tank starts to decrease (we want to plot only the portion of the experiment corresponding to the draining of the tank). Record the initial height of the water in the tank and the time required for the height to reach 2cm. 9 h1_exp X vp_exp x 1383x2 double 1 2 1069 106.8000 9 1070 106.9000 9 1071 107 9 1072 107.1000 1073 107.2000 9 1074 107.3000 9 1075 107.4000 9 1076 107.5000 9 1077 107.6000 9 1078 107.7000 0 1079 107.8000 0 1080 107.9000 0 O o vp_exp x 2 3 1071 16.7951 16.9101 16.9451 16.8202 16.7391 16.9181 h1_exp X 1383x2 double 1 1069 106.8000 1070 106.9000 107 1072 107.1000 1073 107.2000 1074 107.3000 1075 107.4000 1076 107.5000 1077 107.6000 1078 107.7000 1079 107.8000 1080 107.9000 1081 108 1082 108.1000 1083 108.2000 1084 108.3000 16.9809 16.8678 16.9892 16.8409 16.6532 16.4666 16.2810 16.0964 15.9130 15.7305 Using Matlab, plot the data such that the time axis starts at zero at exactly the point where the height of the tank starts to decrease (we want to plot only the portion of the experiment corresponding to the draining of the tank). Record the initial height of the water in the tank and the time required for the height to reach 2cm. 9 h1_exp X vp_exp x 1383x2 double 1 2 1069 106.8000 9 1070 106.9000 9 1071 107 9 1072 107.1000 1073 107.2000 9 1074 107.3000 9 1075 107.4000 9 1076 107.5000 9 1077 107.6000 9 1078 107.7000 0 1079 107.8000 0 1080 107.9000 0 O o vp_exp x 2 3 1071 16.7951 16.9101 16.9451 16.8202 16.7391 16.9181 h1_exp X 1383x2 double 1 1069 106.8000 1070 106.9000 107 1072 107.1000 1073 107.2000 1074 107.3000 1075 107.4000 1076 107.5000 1077 107.6000 1078 107.7000 1079 107.8000 1080 107.9000 1081 108 1082 108.1000 1083 108.2000 1084 108.3000 16.9809 16.8678 16.9892 16.8409 16.6532 16.4666 16.2810 16.0964 15.9130 15.7305Step by Step Solution
There are 3 Steps involved in it
Step: 1

Get Instant Access to Expert-Tailored Solutions
See step-by-step solutions with expert insights and AI powered tools for academic success
Step: 2

Step: 3

Ace Your Homework with AI
Get the answers you need in no time with our AI-driven, step-by-step assistance
Get Started


