

Answered step by step
Verified Expert Solution
Question
1 Approved Answer
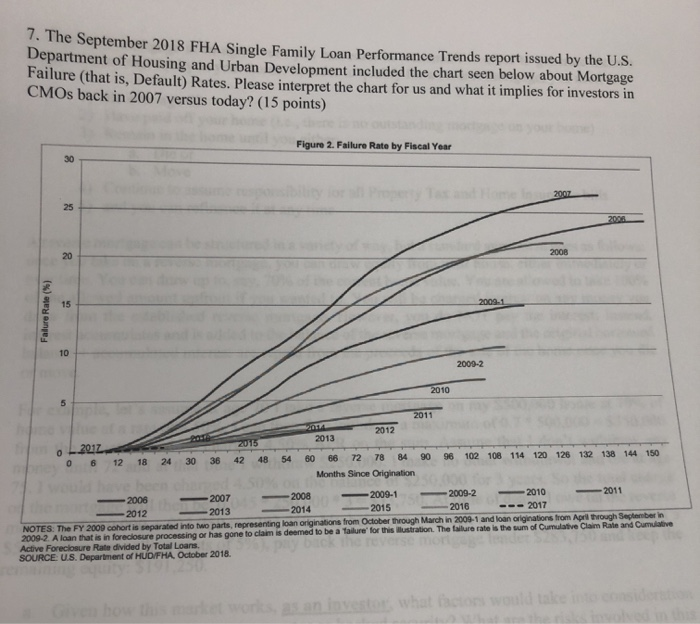
t 7. The September 2018 FHA Single Family Loan Performance Trends report issued by the U.S. Department of Housing and Urban Development included the chart
Step by Step Solution
There are 3 Steps involved in it
Step: 1

Get Instant Access to Expert-Tailored Solutions
See step-by-step solutions with expert insights and AI powered tools for academic success
Step: 2

Step: 3
Ace Your Homework with AI
Get the answers you need in no time with our AI-driven, step-by-step assistance
Get Started
100 Day Money Saving Challenge
Authors: Clubby Parrot
1st Edition
B0CN9F4XBJ