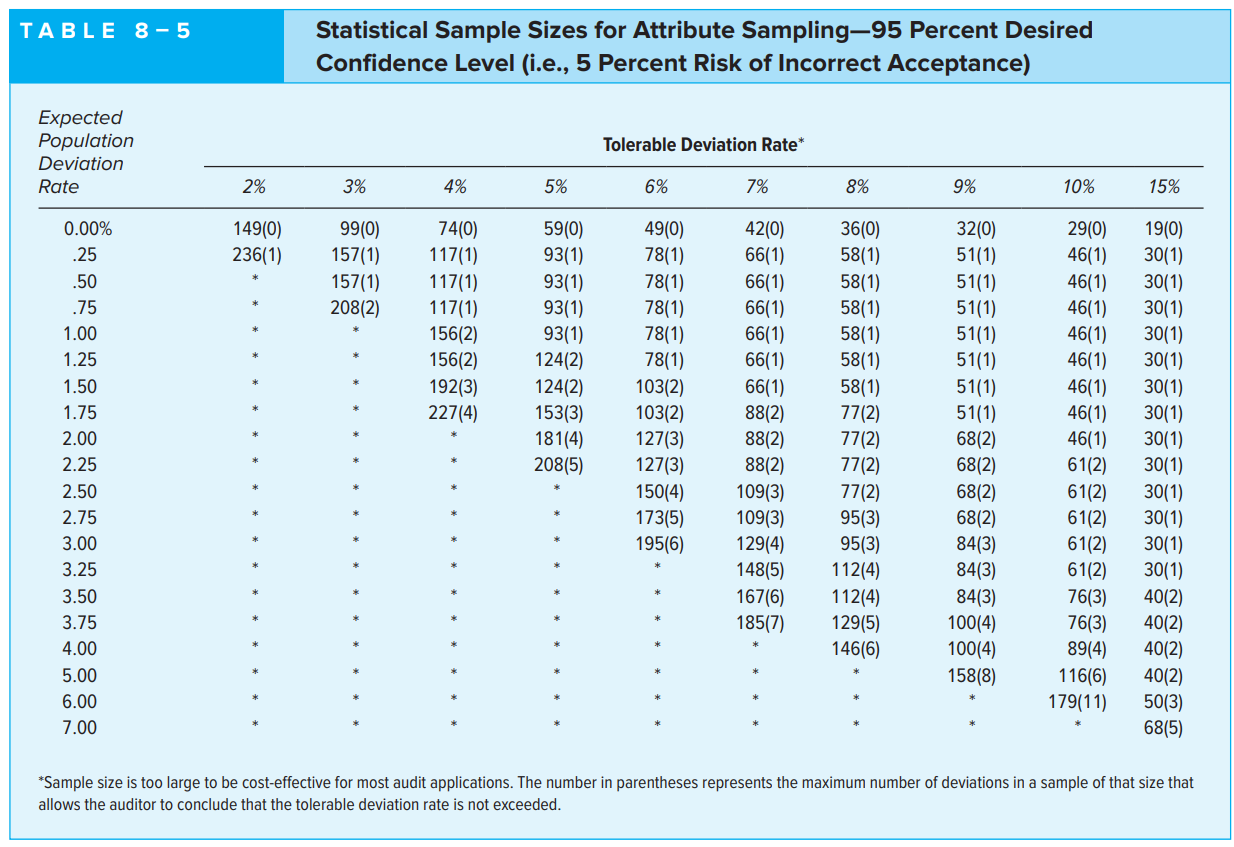
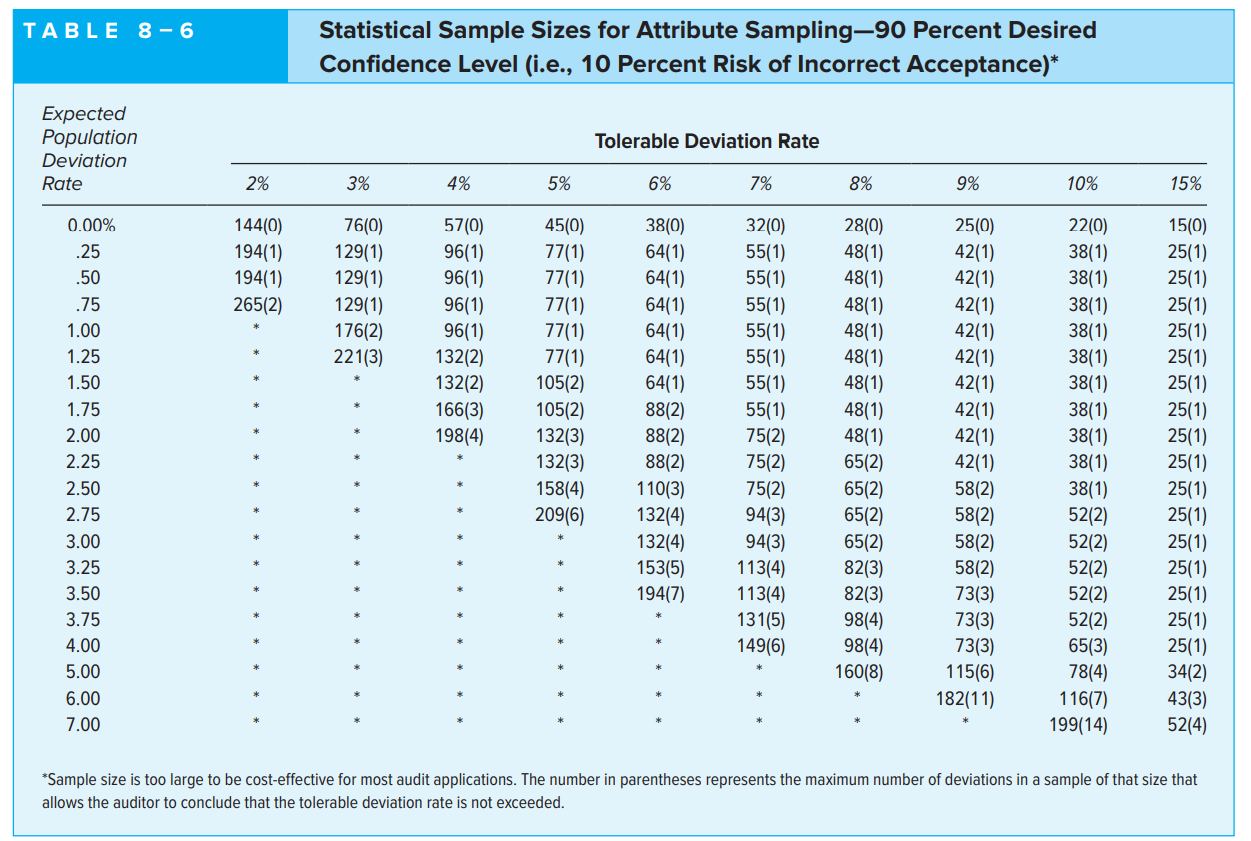
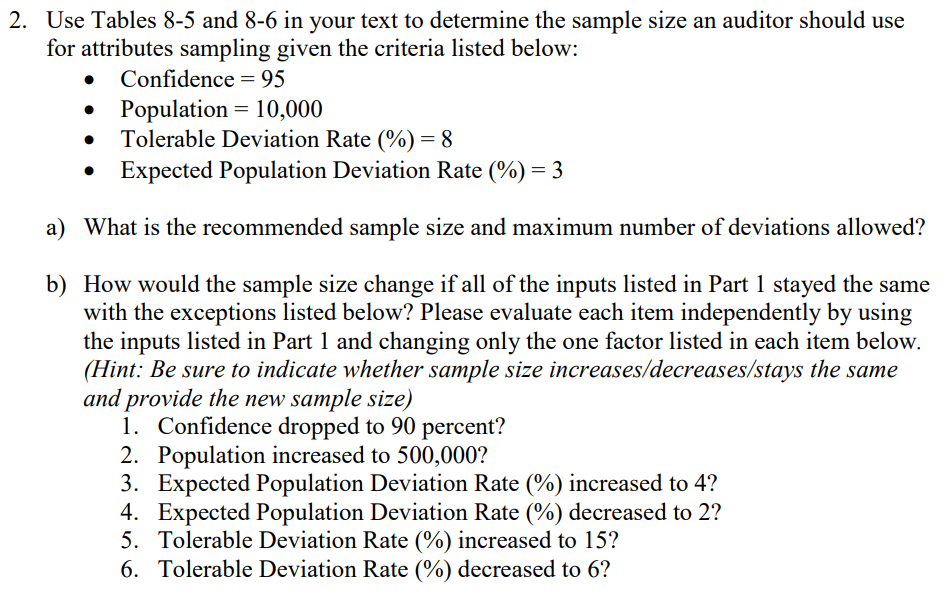
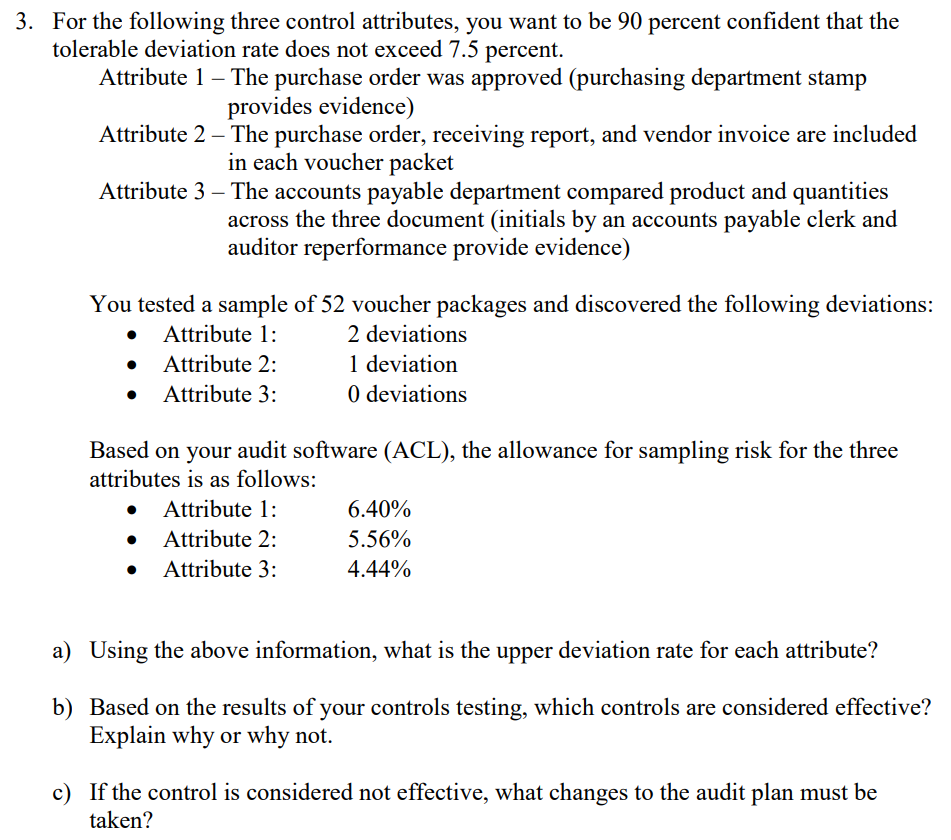
T A B L E 3 5 Statistical Sample Sizes for Attribute Sampling95 Percent Desired Condence Level He, 5 Percent Risk of Incorrect Acceptance) Expected Population Tolerable Deviation Rate' Deviation Rate 2% 3% 4% 5% 6% 7% 3% 9% 10% 15% 0.00% 149(0) 99(0) 74(0) 59(0) 49(0) 42(0) 36(0) 32(0) 29(0) 19(0) .25 236(1) 157(1) 117(1) 93(1) 73(1) 66(1) 53(1) 51(1) 46(1) 30(1) .50 * 157(1) 117(1) 93(1) 73(1) 66(1) 53(1) 51(1) 46(1) 30(1) .75 * 203(2) 117(1) 93(1) 73(1) 66(1) 53(1) 51(1) 46(1) 30(1) 1.00 * * 156(2) 93(1) 73(1) 66(1) 53(1) 51(1) 46(1) 30(1) 1.25 * * 156(2) 124(2) 73(1) 66(1) 53(1) 51(1) 46(1) 30(1) 1.50 * * 192(3) 124(2) 103(2) 66(1) 53(1) 51(1) 46(1) 30(1) 1.75 * * 227(4) 153(3) 103(2) 33(2) 77(2) 51(1) 46(1) 30(1) 2.00 * * * 131(4) 127(3) 33(2) 77(2) 63(2) 46(1) 30(1) 2.25 * * ' 203(5) 127(3) 33(2) 77(2) 63(2) 61(2) 30(1) 2.50 * * * * 150(4) 109(3) 77(2) 63(2) 61(2) 30(1) 2.75 * * * * 173(5) 109(3) 95(3) 63(2) 61(2) 30(1) 3.00 * * * * 195(6) 129(4) 95(3) 34(3) 61(2) 30(1) 3.25 * * * * * 143(5) 1 12(4) 34(3) 61(2) 30(1) 3.50 * * * * * 167(6) 1 12(4) 34(3) 76(3) 40(2) 3.75 * * * * * 135(7) 129(5) 100(4) 76(3) 40(2) 4.00 * * ' * * * 146(6) 100(4) 39(4) 40(2) 5.00 * * * * * * * 153(3) 1 16(6) 40(2) 6.00 * * * * * * * * 179(11) 50(3) 7.00 . . . . t . . t . 535, 'Sample size is too large to be cost-effective for most audit applications. The number in parentheses represents the maximum number of deviations in a sample of that size that allows the auditor to conclude that the tolerable deviation rate is not exceeded. T A B L E 8 6 Statistical Sample Sizes for Attribute Sampling90 Percent Desired Condence Level (i.e., 10 Percent Risk of Incorrect Acceptance)* Expected Population Tolerable Deviation Rate Deviation Rate 2% 3% 4% 5% 6% 7% 3% 9% 10% 15% 0.00% 144(0) 76(0) 57(0) 45(0) 33(0) 32(0) 28(0) 25(0) 22(0) 15(0) .25 194(1) 129(1) 96(1) 77(1) 64(1) 55(1) 48(1) 42(1) 33(1) 25(1) .50 194(1) 129(1) 96(1) 77(1) 64(1) 55(1) 48(1) 42(1) 33(1) 25(1) .75 255(2) 129(1) 96(1) 77(1) 64(1) 55(1) 48(1) 42(1) 33(1) 25(1) 1.00 * 176(2) 96(1) 77(1) 64(1) 55(1) 48(1) 42(1) 33(1) 25(1) 1.25 " 221(3) 132(2) 77(1) 64(1) 55(1) 48(1) 42(1) 33(1) 25(1) 1.50 " ' 132(2) 105(2) 64(1) 55(1) 48(1) 42(1) 33(1) 25(1) 1.75 " ' 166(3) 105(2) 33(2) 55(1) 48( 1) 42(1) 33(1) 25(1) 2.00 " * 198(4) 132(3) 33(2) 75(2) 48( 1) 42(1) 33(1) 25(1) 2.25 " * ' 132(3) 33(2) 75(2) 65(2) 42(1) 33(1) 25(1) 2.50 " * ' 158(4) 1 10(3) 75(2) 65(2) 58(2) 38(1) 25(1) 2.75 * * * 209(6) 132(4) 94(3) 65(2) 58(2) 52(2) 25(1) 3.00 " ' ' * 132(4) 94(3) 65(2) 58(2) 52(2) 25(1) 3.25 " * ' * 153(5) 1 13(4) 82(3) 58(2) 52(2) 25(1) 3.50 * * ' * 194(7) 1 13(4) 82(3) 73(3) 52(2) 25(1) 3.75 * * ' '\" * 131(5) 98(4) 73(3) 52(2) 25(1) 4.00 * ' ' '\" * 149(6) 98(4) 73(3) 65(3) 25(1) 5.00 * ' ' * * * 1 60(8) 1 1 5(6) 78(4) 34(2) 6.00 " ' ' '\" * * \" 182(11) 116(7) 43(3) 7.00 " ' ' * " * \" * 199(14) 52(4) 'Sample size is too large to be cost-effective for most audit applications. The number in parentheses represents the maximum number of deviations in a sample of that size that allows the auditor to conclude that the tolerable deviation rate is not exceeded. 2. Use Tables 8-5 and 8-6 in your text to determine the sample size an auditor should use for attributes sampling given the criteria listed below: 0 Condence = 95 0 Population = 10,000 0 Tolerable Deviation Rate (%) = 8 0 Expected Population Deviation Rate (%) = 3 a) What is the recommended sample size and maximum number of deviations allowed? b) How would the sample size change if all of the inputs listed in Part I stayed the same with the exceptions listed below? Please evaluate each item independently by using the inputs listed in Part 1 and changing only the one factor listed in each item below. (Hint: Be sure to indicate whether sample size increases/decreases/stays the same and provide the new sample size) Condence dropped to 90 percent? Population increased to 500,000? Expected Population Deviation Rate (%) increased to 4? Expected Population Deviation Rate (%) decreased to 2? Tolerable Deviation Rate (%) increased to 15? Tolerable Deviation Rate (%) decreased to 6? CNM-Ih-WMI 3. For the following three control attributes, you want to be 90 percent condent that the tolerable deviation rate does not exceed 7.5 percent. Attribute l The purchase order was approved (purchasing department stamp provides evidence) Attribute 2 The purchase order, receiving report, and vendor invoice are included in each voucher packet Attribute 3 The accounts payable department compared product and quantities across the three document (initials by an accounts payable clerk and auditor reperformance provide evidence) You tested a sample of 52 voucher packages and discovered the following deviations: 0 Attribute l: 2 deviations 0 Attribute 2: l deviation 0 Attribute 3: 0 deviations Based on your audit software (ACL), the allowance for sampling risk for the three attributes is as follows: 0 Attribute l: 6.40% 0 Attribute 2: 5 56% 0 Attribute 3: 4.44% a) Using the above information, what is the upper deviation rate for each attribute? b) Based on the results of your controls testing, which controls are considered effective? Explain why or why not. c) If the control is considered not e'ective, what changes to the audit plan must be taken


