t7 Flag question Question 9 Not yet answered Marked out of 2.00 'l' Flag question Question 10 Not yet answered Marked out of 1.00 V
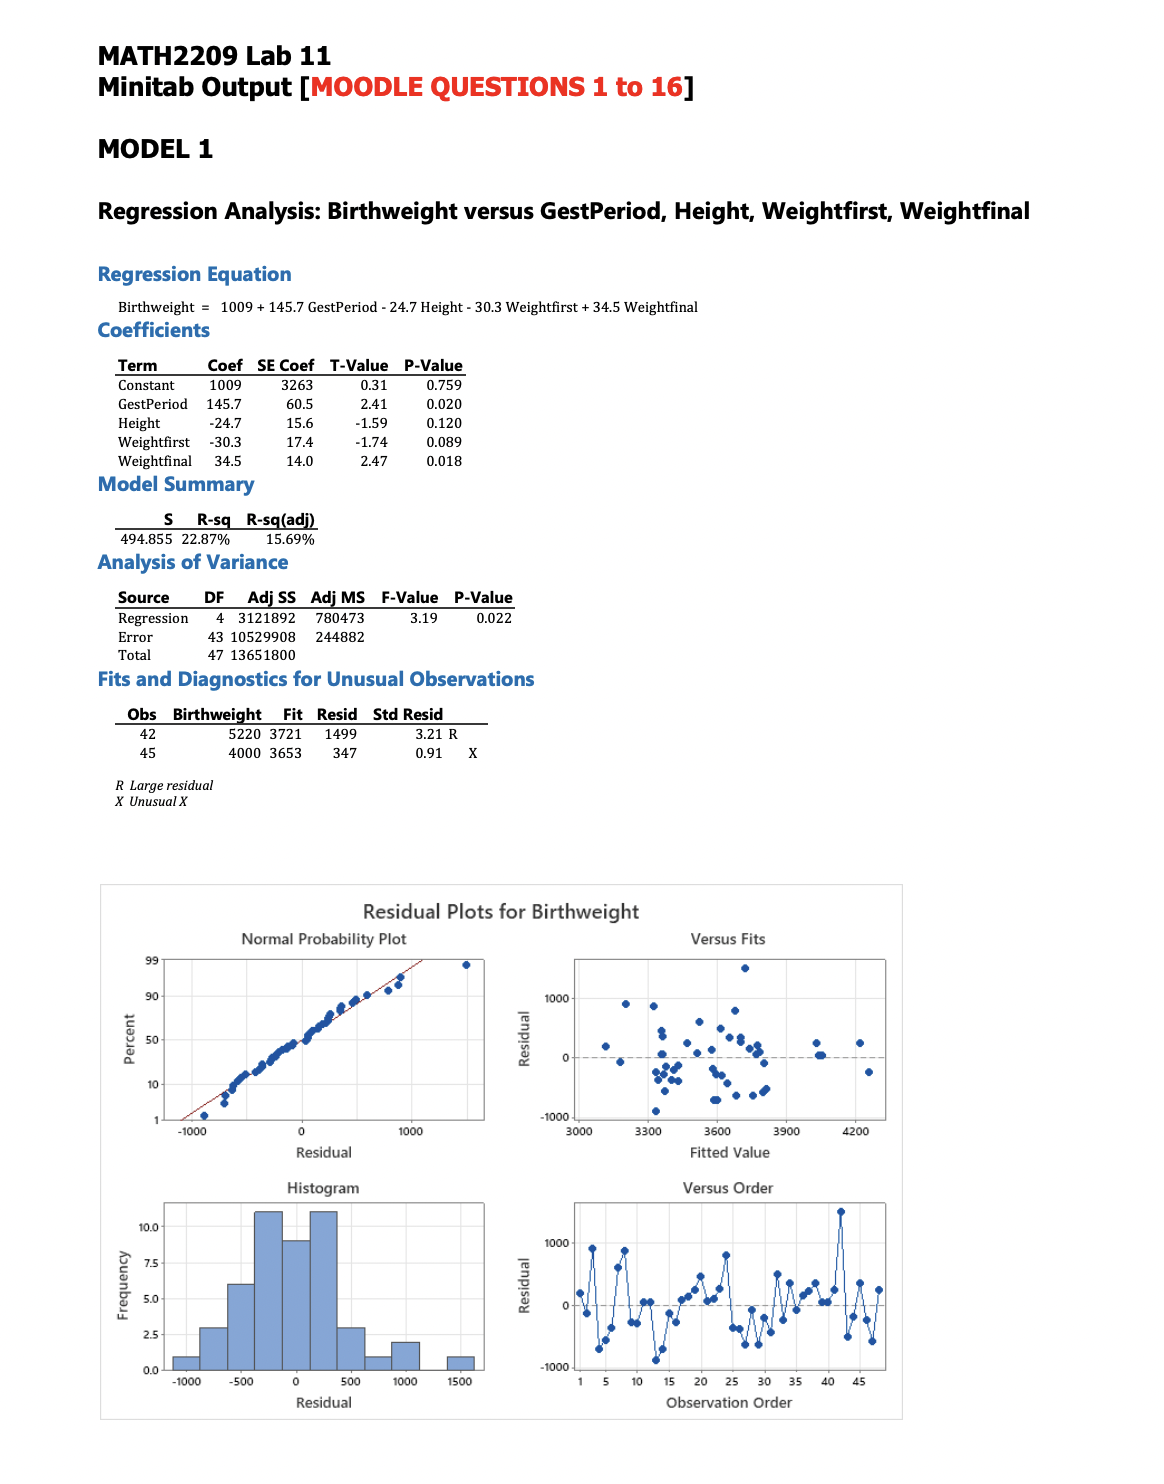
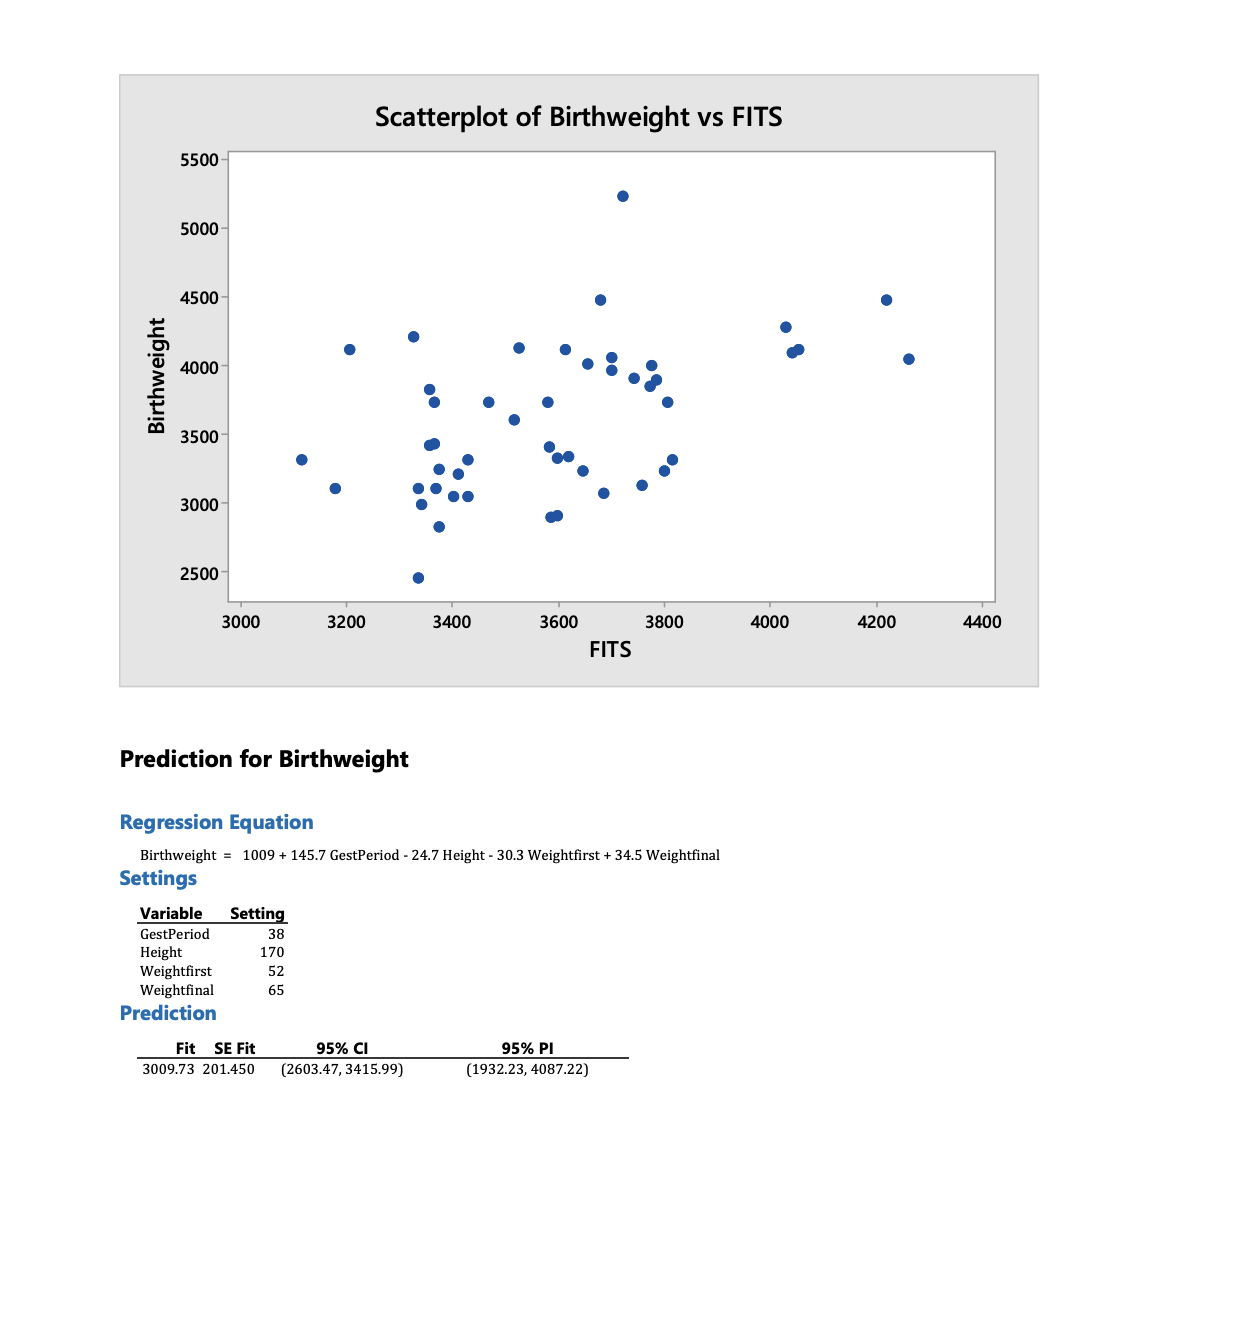
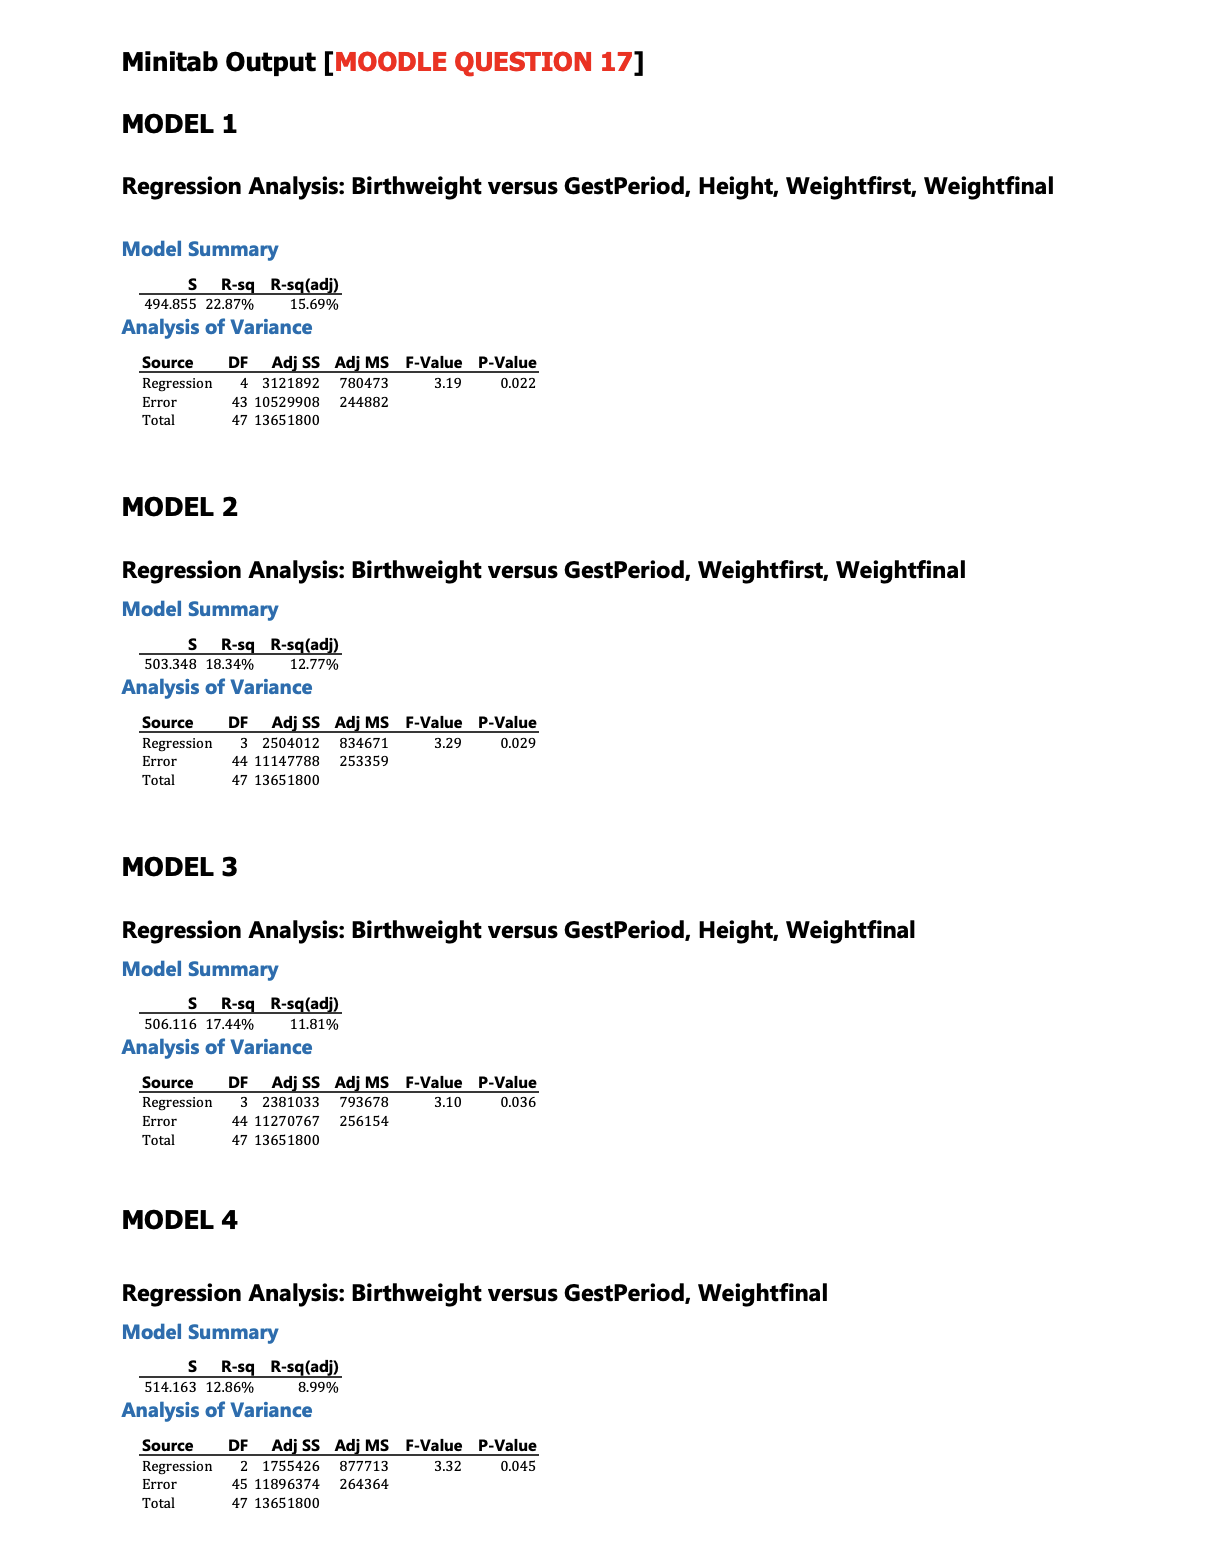
t7 Flag question Question 9 Not yet answered Marked out of 2.00 'l' Flag question Question 10 Not yet answered Marked out of 1.00 V Flag question PART 3: INDIVIDUAL VARIABLES Since there was evidence of a relationship, we can look at the individual variables. Is there evidence that the average birthweight will increase when gestational period increases? State the hypotheses (Ho and Ha) in symbols. Which of the following is the correct interpretation of the parameter? Oa. Ob. Oc. Where [31 represents the increase in average [or mean or expected] birthweight when gestational period increases, with specified values for height, beginning weight, and end weight, for the population of all firsttime mothers. Where [31 represents the increase in average [or mean or expected] birthweight when gestational period increases by 1 week, with specified values for height, beginning weight, and end weight, for the population of all first-time mothers. Where [31 represents the increase in average [or mean or expected] birthweight when gestational period increases by '| week, with specified values for height, beginning weight, and end weight, for the population of all 48 first-time mothers. Where [31 represents the increase in average [or mean or expected] birthweight when gestational period, height, beginning weight, and end weight increases by 1 unit, for the population of all firsttime mothers. Question 1 2 Not yet answered Marked out of 1.00 F Flag question Question 1 3 Not yet answered Marked out of 4.00 F Flag question Question 1 4 Not yet answered Marked out of 2.00 F Flag question Briefly assess the strength of the evidence. 1AvBIEEEoT':. State your conclusion in full context of the problem. 1 AvBI saga o$\" El Although the variable "GestPeriod" is significant, not all of the variables are. Which variable(s) would you consider removing from the model, and why? 1A'BIEEEoTS 5' Information V Flag question Question 1 5 Not yet answered Marked out of 3.00 \\7 Flag question Question 1 6 Not yet answered Marked out of 3.00 F Flag question PART 4: FURTHER EXPLORATION Given that the 95% interval for the coefficient "GestPeriod" is (23.43, 267.97) grams, interpret this interval in the context of the problem. Note: although we have given you the interval here, make sure you know how to calculate it. It will not be on the Minitab Output. Av B I 1 , o 5' El Interpret the 95% prediction interval found on the Minitab output in the context of the problem. 1 Av B I 1 z , o$ El Question 17 Not yet answered Marked out of 2.00 \"F Flag question Based on the four regression models provided on the Minitab output (labelled as Model 1, Model 2, Model 3 and Model 4), which of the models shown would you recommend using, and why? MATH2209 Lab 11 Minitab Output [MOODLE QUESTIONS 1 to 16] MODEL 1 Regression Analysis: Birthweight versus GestPeriod, Height, Weightfirst, Weightfinal Regression Equation Birthweight = 1009 + 145.7 GestPeriod - 24.7 Height - 30.3 Weightfirst + 34.5 Weightfinal Coefficients Term Coef SE Coef T-Value P-Value Constant 1009 3263 0.31 0.759 GestPeriod 145.7 60.5 2.41 0.020 Height -24.7 15.6 -1.59 0.120 Weightfirst -30.3 17.4 -1.74 0.089 Weightfinal 34.5 14.0 2.47 0.018 Model Summary S R-sq R-sq(adj) 494.855 22.87% 15.69% Analysis of Variance Source DF Adj SS Adj MS F-Value P-Value Regression 4 3121892 780473 3.19 0.022 Error 43 10529908 244882 Total 47 1365180 Fits and Diagnostics for Unusual Observations Obs Birthweight Fit Resid Std Resid 42 5220 3721 1499 3.21 R 45 4000 3653 347 0.91 X R Large residual X Unusual X Residual Plots for Birthweight Normal Probability Plot Versus Fits 99 8 100 Residual Percent 1000 1000 1000 3000 3300 3600 3900 4200 Residual Fitted Value Histogram Versus Order 10.0 100 7.5 Residual Frequency 5.0 2.5 1000 -1000 -500 0 500 1000 1500 5 10 15 20 25 30 35 40 45 Residual Observation OrderScatterplot of Birthweight vs FITS 5500- 5000- 4500 4000 Birthweight 3500 3000- 2500 3000 3200 3400 3600 3800 4000 4200 4400 FITS Prediction for Birthweight Regression Equation Birthweight = 1009 + 145.7 GestPeriod - 24.7 Height - 30.3 Weightfirst + 34.5 Weightfinal Settings Variable Setting GestPeriod 38 Heigh 170 Weightfirst 52 Weightfinal 65 Prediction Fit SE Fit 95% CI 95% PI 3009.73 201.450 (2603.47, 3415.99) (1932.23, 4087.22)Minitab Output [MOODLE QUESTION 17] MODEL 1 Regression Analysis: Birthweight versus GestPeriod, Height, Weightfirst, Weightfinal Model Summary S R-sq R-sq(adj) 494.855 22.87% 15.69% Analysis of Variance Source DF Adj SS Adj MS F-Value P-Value Regression 4 3121892 780473 3.19 0.022 Error 43 10529908 244882 Total 17 13651800 MODEL 2 Regression Analysis: Birthweight versus GestPeriod, Weightfirst, Weightfinal Model Summary S R-sq R-sq(adj) 503.348 18.34% 12.77% Analysis of Variance Source DF Adj SS Adj MS F-Value P-Value Regression 3 2504012 834671 3.29 0.029 Error 44 11147788 253359 Total 47 13651800 MODEL 3 Regression Analysis: Birthweight versus GestPeriod, Height, Weightfinal Model Summary S R-sq R-sq(adj) 506.116 17.44% 11.81% Analysis of Variance Source DF Adj SS Adj MS F-Value P-Value Regression 3 2381033 793678 3.10 0.036 Error 44 11270767 256154 Total 47 13651800 MODEL 4 Regression Analysis: Birthweight versus GestPeriod, Weightfinal Model Summary S R-sq R-sq(adj) 514.163 12.86% 8.99% Analysis of Variance Source DF Adj SS Adj MS F-Value P-Value Regression 2 1755426 877713 3.32 0.045 Error 45 11896374 264364 Total 47 1365180
Step by Step Solution
There are 3 Steps involved in it
Step: 1
Get Instant Access to Expert-Tailored Solutions
See step-by-step solutions with expert insights and AI powered tools for academic success
Step: 2
Step: 3
Ace Your Homework with AI
Get the answers you need in no time with our AI-driven, step-by-step assistance