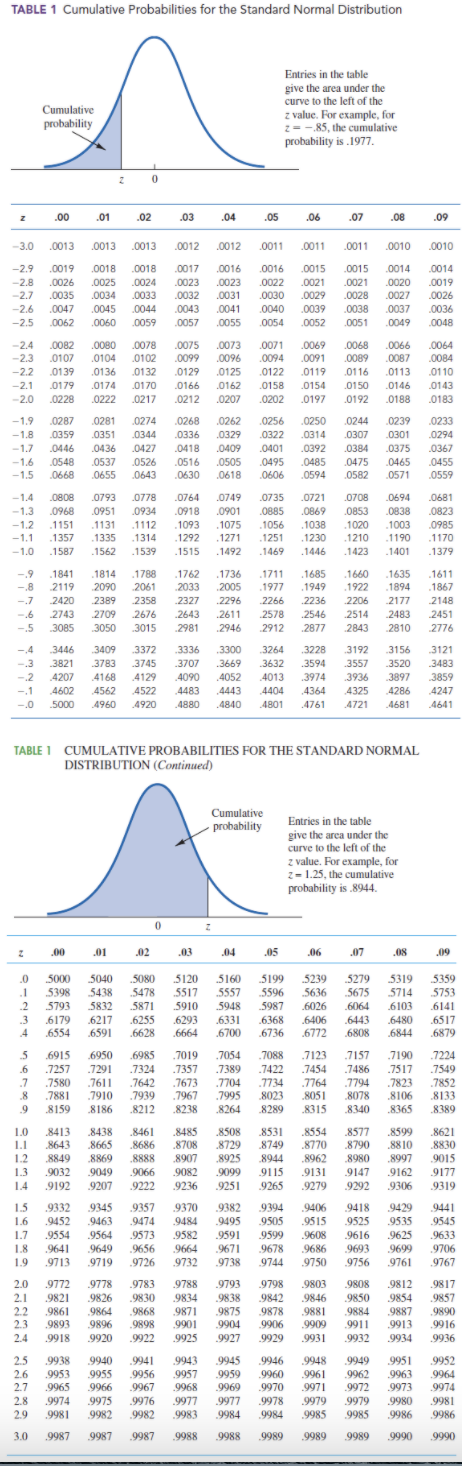
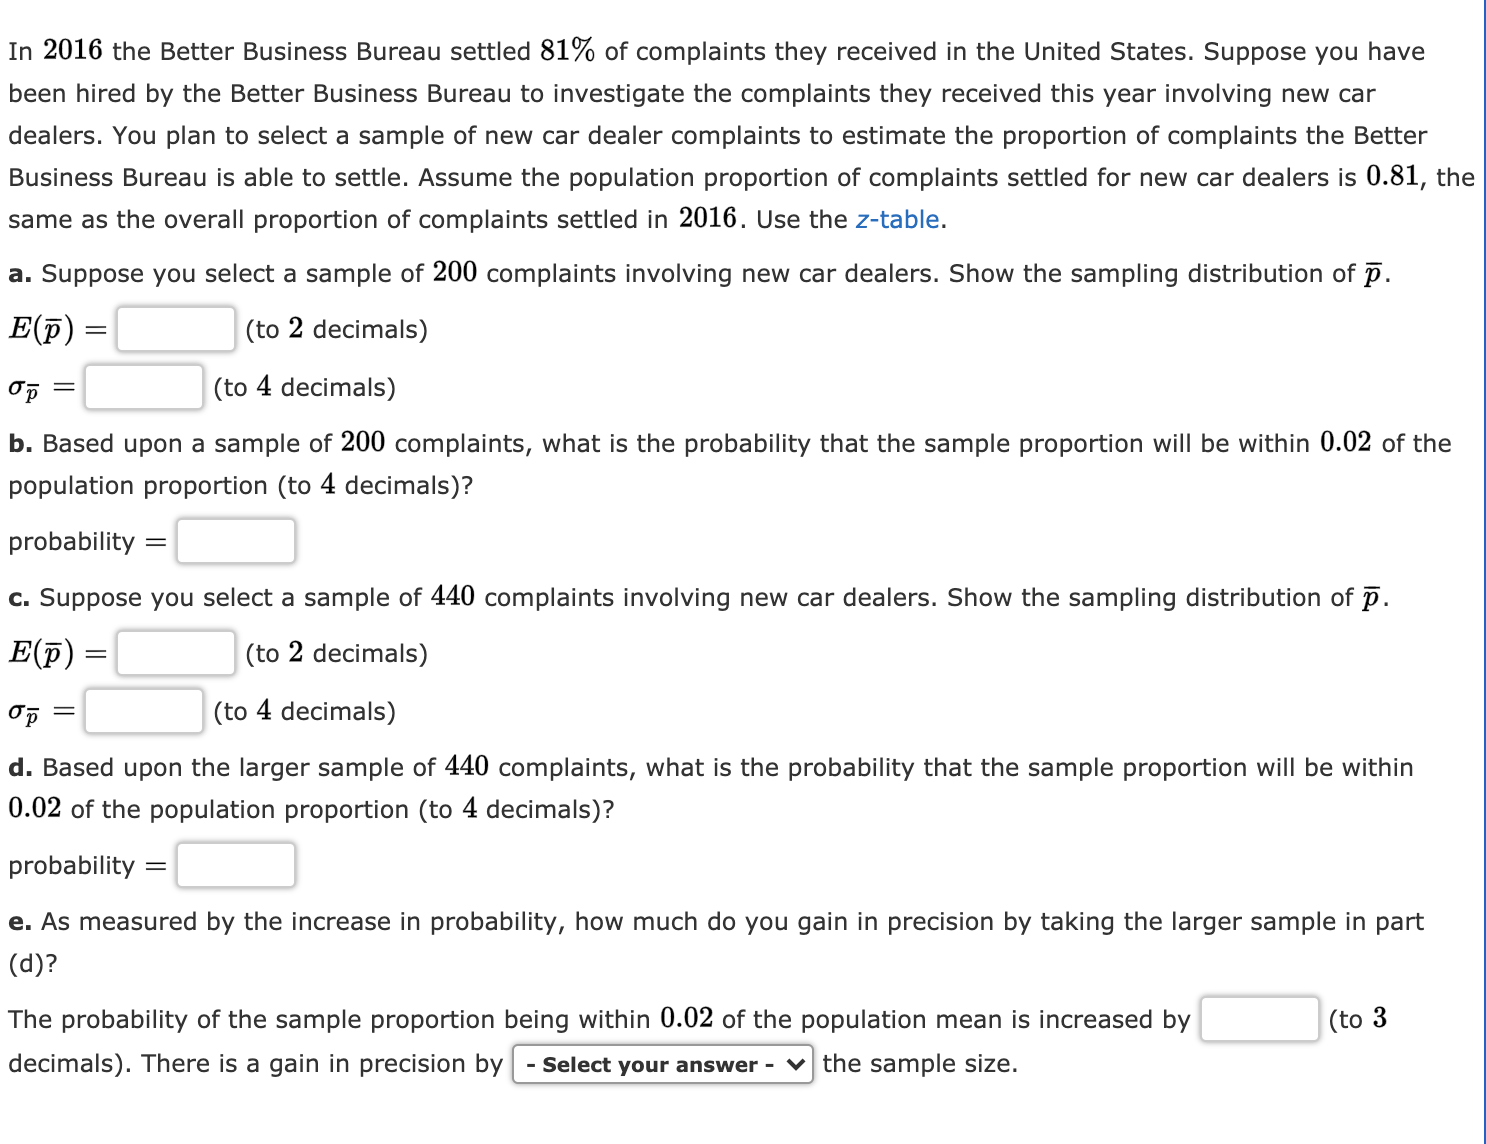
TABLE 1 Cumulative Probabilities for the Standard Normal Distribution Entries in the table give the area under the curve to the left of the Cumulative z value. For example, for probability z = -.85, the cumulative probability is .1977. Z 0 .00 .01 .02 .03 .04 .05 .06 .07 .08 .09 -3.0 .0013 .0013 .0013 .0012 .0012 .0011 .0011 .0011 .0010 .0010 .0018 .0018 .0017 .0016 .0016 .0015 .0015 0014 0014 -2.9 .0019 -2.8 .0026 .0025 .0024 .0023 .0023 .0022 .0021 .0021 0020 .0019 -2.7 .0035 0034 0033 .0032 .0031 0030 .0029 0028 .0027 .0026 -2.6 0045 0044 .0043 .0041 0040 .0039 0038 .0037 .003 .0047 -2.5 0062 .0060 .0059 .0057 .0055 DO54 .0052 .0051 .0049 .0048 0064 -2.4 .0082 .0080 0078 .0075 .0073 0071 0069 .0068 .0066 -2.3 0107 0104 0102 0099 .0096 0094 .0091 0089 .0087 .0084 -2.2 0139 .0136 .0132 .0129 .0125 0122 .0119 .01 16 0113 .0110 -2.1 0179 0174 .0170 .0166 .0162 0158 .0154 .0150 0146 .0143 .0183 -2.0 0228 .0222 .0217 .0212 .0207 .0202 0197 .0192 0188 0287 0281 0274 0268 .0262 0256 .0250 0244 0239 0233 -1.9 .0359 0351 .0344 .0336 .0329 .0322 .0314 .0307 .0301 .0294 -1.8 -1.7 0446 0436 .0427 .0418 .0409 0401 .0392 0384 0375 .0367 -1.6 0548 0526 .0516 0505 0495 0485 0475 0465 .0455 .0537 -1.5 .0668 0655 .0643 0630 .0618 0606 0594 0582 .0571 .0559 -1.4 .0808 0793 .0778 .0764 .0749 .0735 .0721 .0708 .0694 .068 -1.3 .0968 .0951 .0934 .0918 .0901 0885 .0869 0853 0838 .0823 -1.2 .1151 1131 .1112 .1093 1075 1056 .1038 1020 .1003 .0985 -1.1 -135 .1335 .1314 .1292 .1271 .1251 .1230 .1210 1190 .1170 -1.0 -1587 1562 .1539 .1515 .1492 .1469 .1446 .1423 -1401 -1379 -.9 .1841 .1814 1788 1762 .1736 .1711 1685 1660 .1635 .161 -.8 .2119 2090 .2061 .2033 .2005 .1977 .1949 .1922 .1894 .1867 -.7 .2420 2389 .2358 .2327 .2296 2266 .2236 2206 2177 .2148 .2743 .270 .2676 .2643 .2611 .2578 .2546 .2514 .2483 .2451 -.6 - 5 .3085 3050 .3015 .2981 .2946 .2912 2877 2843 .2810 .2776 -.4 3446 3409 3372 3336 .3300 3264 .3228 .3192 .3156 .312 .3783 .3745 .3707 .3669 .3632 .3594 .3557 .3520 .3483 -.3 .3821 -.2 4207 4168 4129 4090 4052 4013 .3974 3936 3897 385 4602 4562 4522 4483 4443 4404 .4364 4325 4286 4247 -.1 5000 4960 4920 .4880 .4840 4801 .4761 4721 4681 4641 TABLE 1 CUMULATIVE PROBABILITIES FOR THE STANDARD NORMAL DISTRIBUTION (Continued) Cumulative probability Entries in the table give the area under the curve to the left of the z value. For example, for z = 1.25, the cumulative probability is .8944. 0 Z .00 .01 02 .03 .04 .05 06 .07 08 .09 5000 5040 5080 5120 5160 5199 5239 5279 5319 5359 5398 5438 5478 5517 .5557 5596 5636 5675 5714 .5753 5793 5832 .5871 .5910 .5948 5987 .6026 6064 6103 6141 6179 .6217 .6255 .6293 .6331 6368 .6406 6443 6480 .651 6554 6591 .6628 6664 6700 6736 6772 6808 6844 6879 6950 6985 .7019 7054 7088 .7123 7157 .7190 .7224 6915 .725 .7291 .7324 .7357 .7389 .7422 .7454 .7486 .7517 .754 .7642 .7704 .7734 .7764 .779 .7852 .7580 .7611 7673 .7823 .7881 .7910 .7939 .7967 .7995 8023 .8051 .8078 .8106 .8133 .8159 8186 .8212 .8238 .8264 3289 8315 8340 .8365 8389 .8413 8438 .8461 8485 8508 8531 8554 8577 .8599 .862 1.0 .8643 .8665 .8686 .8708 .8729 8790 .8810 .883 1.1 .8749 .8770 1.2 8849 8869 8888 .8907 ,8925 8944 .8962 8980 .8997 .9015 1.3 9032 9049 9066 .9082 9099 9115 .9131 9147 .9162 9177 .9192 9207 9222 .9236 9251 9265 .9279 9292 .9306 9319 9332 9345 9357 9370 9382 9394 9406 9418 9429 .9441 1.5 9525 9535 9545 1.6 .9452 9463 .9474 9484 .9495 .9505 9515 1.7 .9554 .9564 .9573 .9582 .9591 9599 .9608 9616 .9625 .9633 1.8 .964 9649 .9656 9664 9671 9678 9686 969 .9699 .9706 1.9 9713 9719 9726 9732 9738 9744 9750 9756 976 9767 9808 .9812 .9817 2.0 .9772 .9778 9783 9788 .9793 .9798 980 2.1 .9821 9826 .9830 .9834 .9838 9842 .9846 .9850 .9854 .9857 2.2 .9861 .9864 .9868 .9871 9875 BL86 9881 .9884 .9887 .9890 2.3 .989 9896 .9898 .9901 9904 9906 .9909 .9911 .9913 9916 2.4 .9918 9920 9922 9925 9927 9929 9931 9932 9934 9936 9949 9951 9952 2.5 .9938 9940 9941 9943 9945 9946 9948 2.6 .9953 9955 9956 .9957 .9959 9960 .9961 9962 .9963 .9964 2.7 .9965 .9966 9967 .9968 9969 9970 .9971 .9972 .9973 .9974 2.8 .9974 9975 .9976 .9977 9977 .9978 .9979 9979 .9980 9981 29 9981 .9982 9982 .9983 9984 .9984 .9985 9985 9986 9986 3.0 .9987 .9987 .9987 .9988 9988 .9989 .9989 .9989 .9990 .9990In 2016 the Better Business Bureau settled 81% of complaints they received in the United States. Suppose you have been hired by the Better Business Bureau to investigate the complaints they received this year involving new car dealers. You plan to select a sample of new car dealer complaints to estimate the proportion of complaints the Better Business Bureau is able to settle. Assume the population proportion of complaints settled for new car dealers is 0.81, the same as the overall proportion of complaints settled in 2016. Use the z-table. 3. Suppose you select a sample of 200 complaints involving new car dealers. Show the sampling distribution of 13. 13(5) = (to 2 decimals) 0,3 = (to 4 decimals) b. Based upon a sample of 200 complaints, what is the probability that the sample proportion will be within 0.02 of the population proportion (to 4 decimals)? probability = c. Suppose you select a sample of 440 complaints involving new car dealers. Show the sampling distribution of 1). Eu?) 2 (to 2 decimals) 0,3 = (to 4 decimals) d. Based upon the larger sample of 440 complaints, what is the probability that the sample proportion will be within 0.02 of the population proportion (to 4 decimals)? probability 2 e. As measured by the increase in probability, how much do you gain in precision by taking the larger sample in part (cl)? The probability of the sample proportion being within 0.02 of the population mean is increased by (to 3 decimals). There is a gain in precision by - Select your answer - v the sample size