

Question
Table 1 presents the forecasted financial statements that extend into the infinite horizon (the Table only shows the first five years of forecasts). Note that
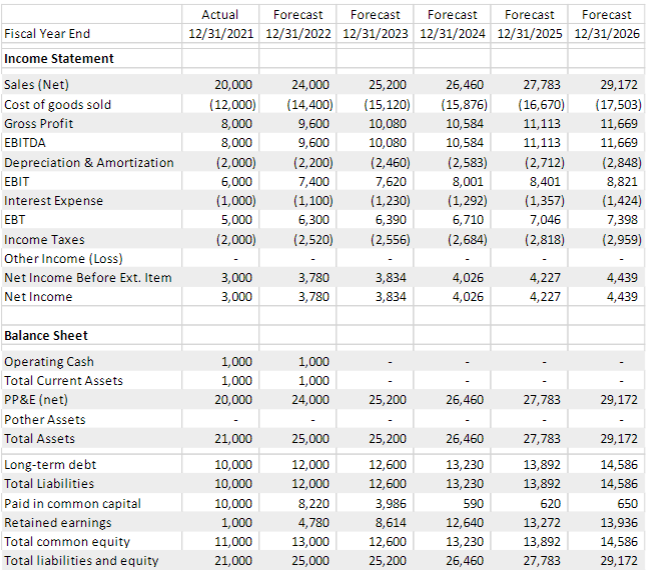
Table 1 presents the forecasted financial statements that extend into the infinite horizon (the Table only shows the first five years of forecasts). Note that year 2024 is the terminal period (growth rate in 2024 and all years after is a constant 5%). In addition, you should assume that the cost of equity capital is 10 percent. Also assume there are 1,000 shares outstanding and divide your valuation by 1,000 to get the price per share. .
Valuation Models 1) Find the forecasted residual income for 2022 and beyond. 2) Compute the value of common equity as of December 31, 2021, using the residual income model. Calculate the price per share. 3) Find the forecasted free cash flow to common equity for 2022 and beyond. 4) Compute the value of common equity as of December 31, 2021, using the free cash flow to common equity model. Calculate the price per share.
Accounting Distortions Suppose that our company shifts $2,000 of noncash income from fiscal 2023 to fiscal 2022. There are many ways they could do this: accelerating the recognition of revenue or deferring the recognition of an expense. Because the shifted income is not a real cash flow, it must necessarily increase an asset account in 2022 by $2,000, and this account will reverse in 2023. To make the computations transparent, suppose the shifted income was in the line item Other Income and the associated asset account was Other Assets. Further, suppose that all other income statement items, assets, and liabilities remain the same (common shareholders equity will obviously change). 5) Alter the financial statements in Table 1 to show the income shifting just described. Based on these new financial statements, compute the value of common equity as of December 31, 2021, using the residual income to common equity model. 6) The income shifting clearly moves the recognition of net income forward in time and money has time value, so why has this accounting distortion not changed the value of the equity? (Hint: Your answer to question 5 should match the value you computed in question 2).
Actual Forecast Forecast Forecast Forecast Forecast 12/31/2021 12/31/2022 12/31/2023 12/31/2024 12/31/2025 12/31/2026 Fiscal Year End Income Statement Sales (Net) Cost of goods sold Gross Profit EBITDA Depreciation & Amortization EBIT Interest Expense EBT Income Taxes Other Income (Loss) Net Income Before Ext. Item Net Income 20,000 (12,000) 8,000 8,000 (2,000) 6,000 (1,000) 5,000 (2,000) 24,000 (14,400) 9,600 9,600 (2,200) 7,400 (1.100) 6,300 (2,520) 25,200 (15,120) 10,080 10,080 (2,460) 7,620 (1,230) 6,390 (2,556) 26,460 (15,876) 10,584 10,584 (2,583) 8,001 (1,292) 6,710 (2,684) 27,783 (16,670) 11,113 11,113 (2,712) 8,401 (1,357) 7,046 (2,818) 29,172 (17,503) 11,669 11,669 (2,848) 8,821 (1,424) 7,398 (2,959) 3,000 3,000 3,780 3,780 3,834 3,834 4,026 4,026 4,227 4,227 4,439 4,439 1,000 1,000 20,000 1,000 1,000 24,000 ! ! 25,200 26,460 27,783 29,172 Balance Sheet Operating Cash Total Current Assets PP&E (net) Pother Assets Total Assets Long-term debt Total Liabilities Paid in common capital Retained earnings Total common equity Total liabilities and equity 21,000 10,000 10,000 10,000 1,000 11,000 21,000 25,000 12,000 12,000 8,220 4,780 13,000 25,000 25,200 12,600 12,600 3,986 8,614 12,600 25,200 26,460 13,230 13,230 590 12,640 13,230 26,460 27,783 13,892 13,892 620 13,272 13,892 27,783 29,172 14,586 14,586 650 13,936 14,586 29,172 Actual Forecast Forecast Forecast Forecast Forecast 12/31/2021 12/31/2022 12/31/2023 12/31/2024 12/31/2025 12/31/2026 Fiscal Year End Income Statement Sales (Net) Cost of goods sold Gross Profit EBITDA Depreciation & Amortization EBIT Interest Expense EBT Income Taxes Other Income (Loss) Net Income Before Ext. Item Net Income 20,000 (12,000) 8,000 8,000 (2,000) 6,000 (1,000) 5,000 (2,000) 24,000 (14,400) 9,600 9,600 (2,200) 7,400 (1.100) 6,300 (2,520) 25,200 (15,120) 10,080 10,080 (2,460) 7,620 (1,230) 6,390 (2,556) 26,460 (15,876) 10,584 10,584 (2,583) 8,001 (1,292) 6,710 (2,684) 27,783 (16,670) 11,113 11,113 (2,712) 8,401 (1,357) 7,046 (2,818) 29,172 (17,503) 11,669 11,669 (2,848) 8,821 (1,424) 7,398 (2,959) 3,000 3,000 3,780 3,780 3,834 3,834 4,026 4,026 4,227 4,227 4,439 4,439 1,000 1,000 20,000 1,000 1,000 24,000 ! ! 25,200 26,460 27,783 29,172 Balance Sheet Operating Cash Total Current Assets PP&E (net) Pother Assets Total Assets Long-term debt Total Liabilities Paid in common capital Retained earnings Total common equity Total liabilities and equity 21,000 10,000 10,000 10,000 1,000 11,000 21,000 25,000 12,000 12,000 8,220 4,780 13,000 25,000 25,200 12,600 12,600 3,986 8,614 12,600 25,200 26,460 13,230 13,230 590 12,640 13,230 26,460 27,783 13,892 13,892 620 13,272 13,892 27,783 29,172 14,586 14,586 650 13,936 14,586 29,172Step by Step Solution
There are 3 Steps involved in it
Step: 1

Get Instant Access to Expert-Tailored Solutions
See step-by-step solutions with expert insights and AI powered tools for academic success
Step: 2

Step: 3
Ace Your Homework with AI
Get the answers you need in no time with our AI-driven, step-by-step assistance
Get Started
Practical financial management
Authors: William r. Lasher
5th Edition
0324422636, 978-0324422634