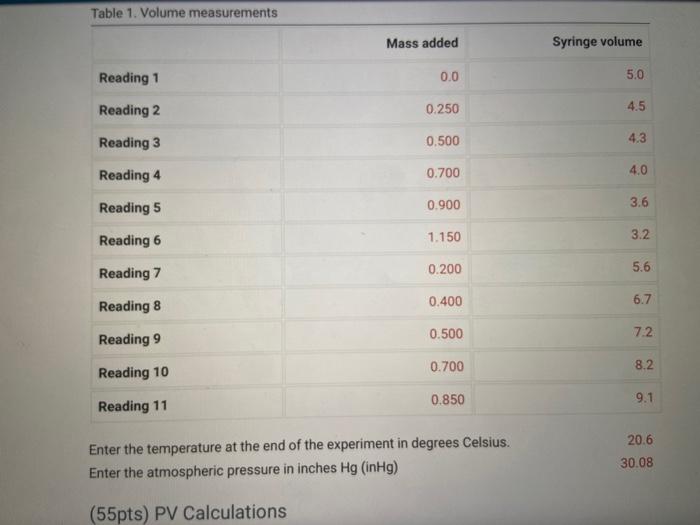
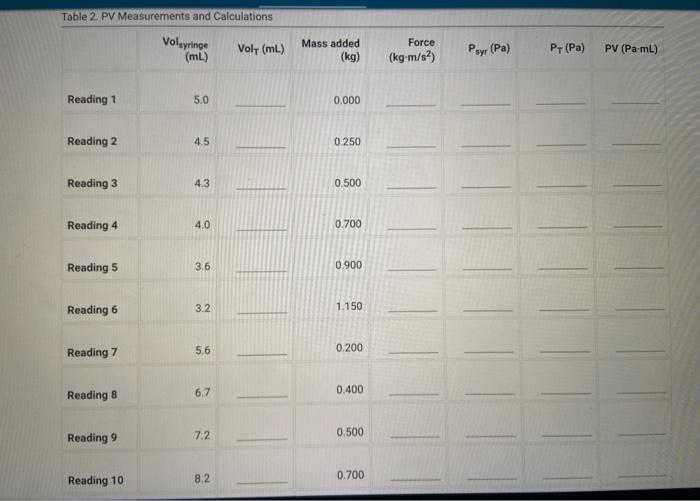
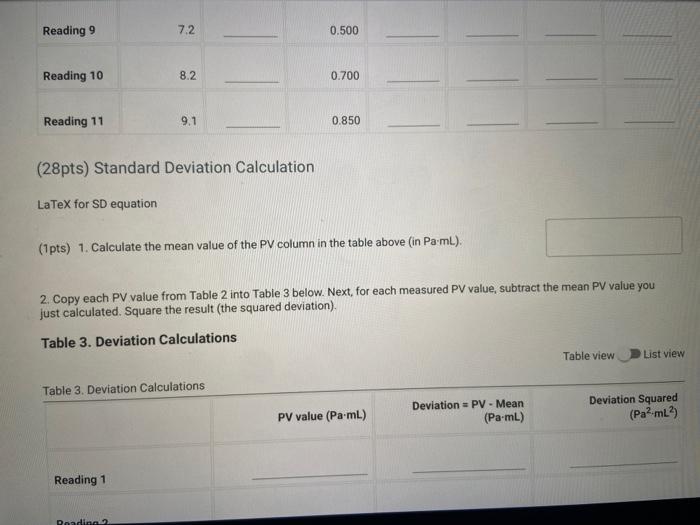
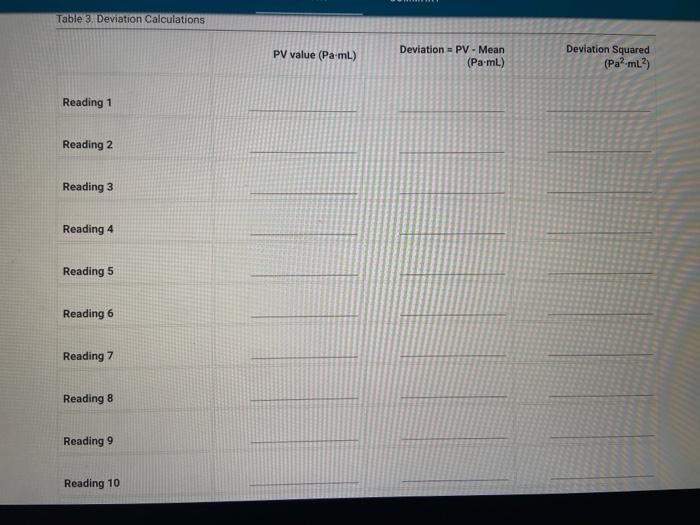
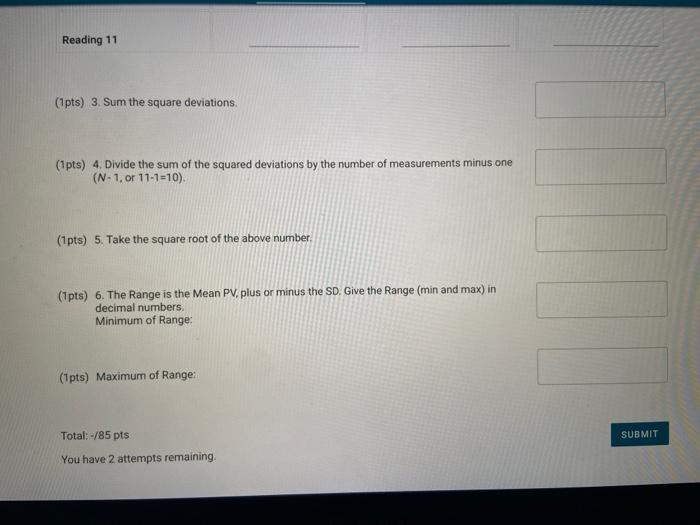
Table 1. Volume measurements Mass added Syringe volume Reading 1 0.0 5.0 Reading 2 0.250 4.5 Reading 3 0.500 4.3 Reading 4 0.700 4.0 Reading 5 0.900 3.6 1.150 3.2 Reading 6 0.200 5.6 Reading 7 0.400 6.7 Reading 8 0.500 72 Reading 9 0.700 8.2 Reading 10 0.850 9.1 Reading 11 20.6 Enter the temperature at the end of the experiment in degrees Celsius. Enter the atmospheric pressure in inches Hg (inHg) 30.08 (55pts) PV Calculations Table 2. PV Measurements and Calculations Voluyringe (mL) Volt (mL) Mass added (kg) Force (kg-m/s) Psy (Pa) PT (Pa) PV (Pa-mL) Reading 1 5.0 0.000 Reading 2 4.5 0.250 Reading 3 4.3 0.500 Reading 4 4.0 0.700 Reading 5 3.6 0.900 Reading 6 3.2 1.150 Reading 7 5.6 0.200 6.7 0.400 Reading 8 7.2 0.500 Reading 9 8.2 0.700 Reading 10 Reading 9 7.2 0.500 Reading 10 8.2 0.700 Reading 11 9.1 0.850 (28pts) Standard Deviation Calculation LaTeX for SD equation (1pts) 1. Calculate the mean value of the PV column in the table above in Pa.mL). 2. Copy each PV value from Table 2 into Table 3 below. Next, for each measured PV value, subtract the mean PV value you just calculated. Square the result (the squared deviation). Table 3. Deviation Calculations Table view List view Table 3. Deviation Calculations Deviation = PV - Mean (Pa-mL) Deviation Squared (Pa? mL) PV value (Pa.mL) Reading 1 Roadina Table 3. Deviation Calculations PV value (Pa-mL) Deviation - PV - Mean (Pa.mL) Deviation Squared (Pa ml? Reading 1 Reading 2 Reading 3 Reading 4 Reading 5 Reading 6 Reading 7 Reading 8 Reading 9 Reading 10 Reading 11 (pts) 3. Sum the square deviations (1pts) 4. Divide the sum of the squared deviations by the number of measurements minus one (N-1, or 11-1=10) (1pts) 5. Take the square root of the above number (1pts) 6. The Range is the Mean PV, plus or minus the SD. Give the Range (min and max) in decimal numbers. Minimum of Range: (1pts) Maximum of Range: Total:-/85 pts SUBMIT You have 2 attempts remaining