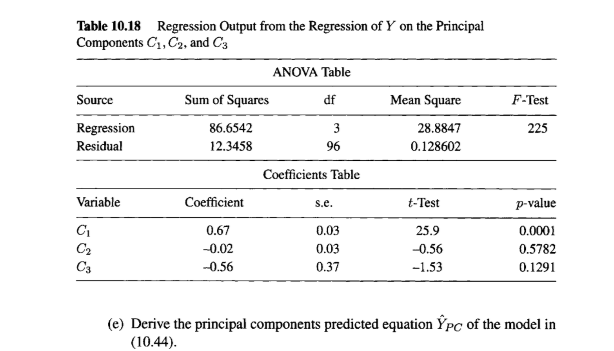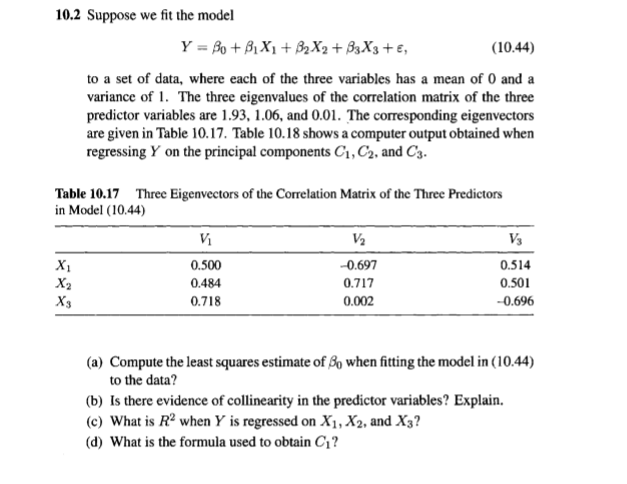

Table 10.18 Regression Output from the Regression of Y on the Principal Components C1,C2, and C3 ANOVA Table Source Sum of Squares df Mean Square Regression 86.6542 3 28.8847 Residual 12.3458 96 0.128602 Coefficients Table F-Test 225 Variable Coefficient s.e. t-Test p-value C C2 Cg 0.67 0.02 -0.56 0.03 0.03 0.37 25.9 -0.56 -1.53 0.0001 0.5782 0.1291 (e) Derive the principal components predicted equation Ypc of the model in (10.44). 10.2 Suppose we fit the model Y = Bo +B, X +B2X2+B3X3 +, (10.44) to a set of data, where each of the three variables has a mean of 0 and a variance of 1. The three eigenvalues of the correlation matrix of the three predictor variables are 1.93, 1.06, and 0.01. The corresponding eigenvectors are given in Table 10.17. Table 10.18 shows a computer output obtained when regressing Y on the principal components C1, C2, and C3. Table 10.17 Three Eigenvectors of the Correlation Matrix of the Three Predictors in Model (10.44) Vi V2 Vs X 0.500 -0.697 0.514 X2 0.484 0.717 0.501 X3 0.718 0.002 -0.696 (a) Compute the least squares estimate of Bo when fitting the model in (10.44) to the data? (b) Is there evidence of collinearity in the predictor variables? Explain. (c) What is R2 when Y is regressed on X1, X2, and X3? (d) What is the formula used to obtain C? Table 10.18 Regression Output from the Regression of Y on the Principal Components C1,C2, and C3 ANOVA Table Source Sum of Squares df Mean Square Regression 86.6542 3 28.8847 Residual 12.3458 96 0.128602 Coefficients Table F-Test 225 Variable Coefficient s.e. t-Test p-value C C2 Cg 0.67 0.02 -0.56 0.03 0.03 0.37 25.9 -0.56 -1.53 0.0001 0.5782 0.1291 (e) Derive the principal components predicted equation Ypc of the model in (10.44). 10.2 Suppose we fit the model Y = Bo +B, X +B2X2+B3X3 +, (10.44) to a set of data, where each of the three variables has a mean of 0 and a variance of 1. The three eigenvalues of the correlation matrix of the three predictor variables are 1.93, 1.06, and 0.01. The corresponding eigenvectors are given in Table 10.17. Table 10.18 shows a computer output obtained when regressing Y on the principal components C1, C2, and C3. Table 10.17 Three Eigenvectors of the Correlation Matrix of the Three Predictors in Model (10.44) Vi V2 Vs X 0.500 -0.697 0.514 X2 0.484 0.717 0.501 X3 0.718 0.002 -0.696 (a) Compute the least squares estimate of Bo when fitting the model in (10.44) to the data? (b) Is there evidence of collinearity in the predictor variables? Explain. (c) What is R2 when Y is regressed on X1, X2, and X3? (d) What is the formula used to obtain C


