

Question
Table 17.8 gives the monthly international passenger totals over the last 11 years for an airline company. A plot of these passenger totals reveals an
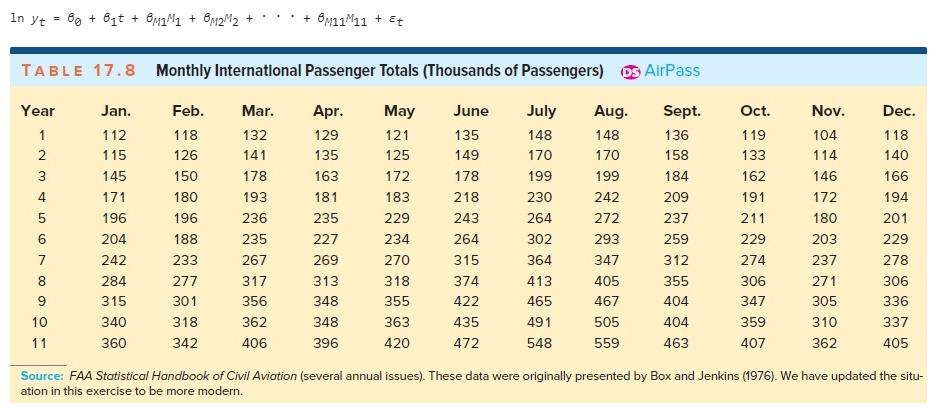
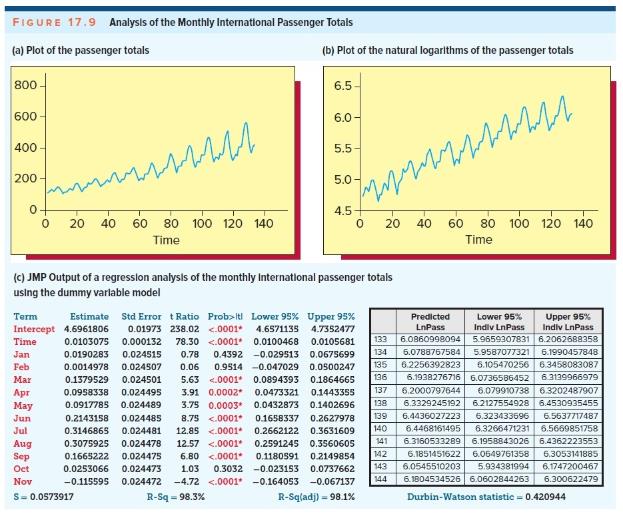
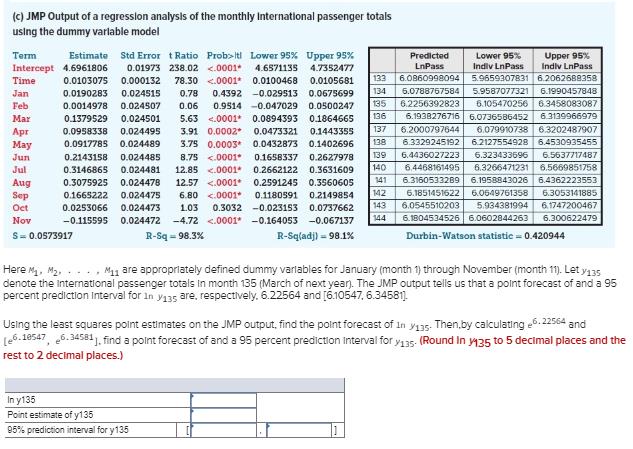
Table 17.8 gives the monthly international passenger totals over the last 11 years for an airline company. A plot of these passenger totals reveals an upward trend with increasing seasonal variation, and the natural logarithmic transformation is found to best equalize the seasonal variation [see Figure 17.9(a) and (b)]. Figure 17.9(c) gives the JMP output of a regression analysis of the monthly international passenger totals by using the model
Step by Step Solution
There are 3 Steps involved in it
Step: 1

Get Instant Access to Expert-Tailored Solutions
See step-by-step solutions with expert insights and AI powered tools for academic success
Step: 2

Step: 3
Ace Your Homework with AI
Get the answers you need in no time with our AI-driven, step-by-step assistance
Get Started
Algebra 2
Authors: Edward B. Burger, Juli K. Dixon, Steven J. Leinwand, Timothy D. Kanold
1st Edition
0544385918, 978-0544385917