

Question
Table 2 is a gene expression microarray data, where each row represents a sample for a person, each column represents a gene, and each entry
Table 2 is a gene expression microarray data, where each row represents a sample for a person, each column represents a gene, and each entry represents gene expression value. The output of each sample indicates whether a specific disease exists in this sample. Please use Manhattan Distance-Weighted KNN (K=3) to predict the output of the sample 11 and sample 12. Hint: you need to calculate the weights instead of simply count how many Yeses and Nos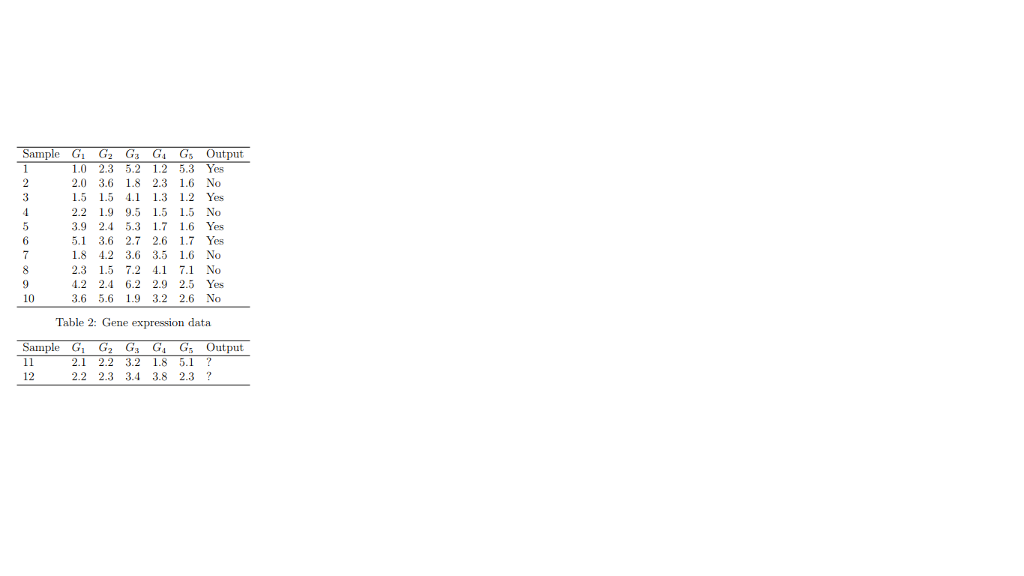
Step by Step Solution
There are 3 Steps involved in it
Step: 1

Get Instant Access to Expert-Tailored Solutions
See step-by-step solutions with expert insights and AI powered tools for academic success
Step: 2

Step: 3
Ace Your Homework with AI
Get the answers you need in no time with our AI-driven, step-by-step assistance
Get Started
The Next Step In Database Marketing Consumer Guided Marketing Privacy For Your Customers Record Profits For You
Authors: Dick Shaver
1st Edition
0471133590, 978-0471133599