

Question
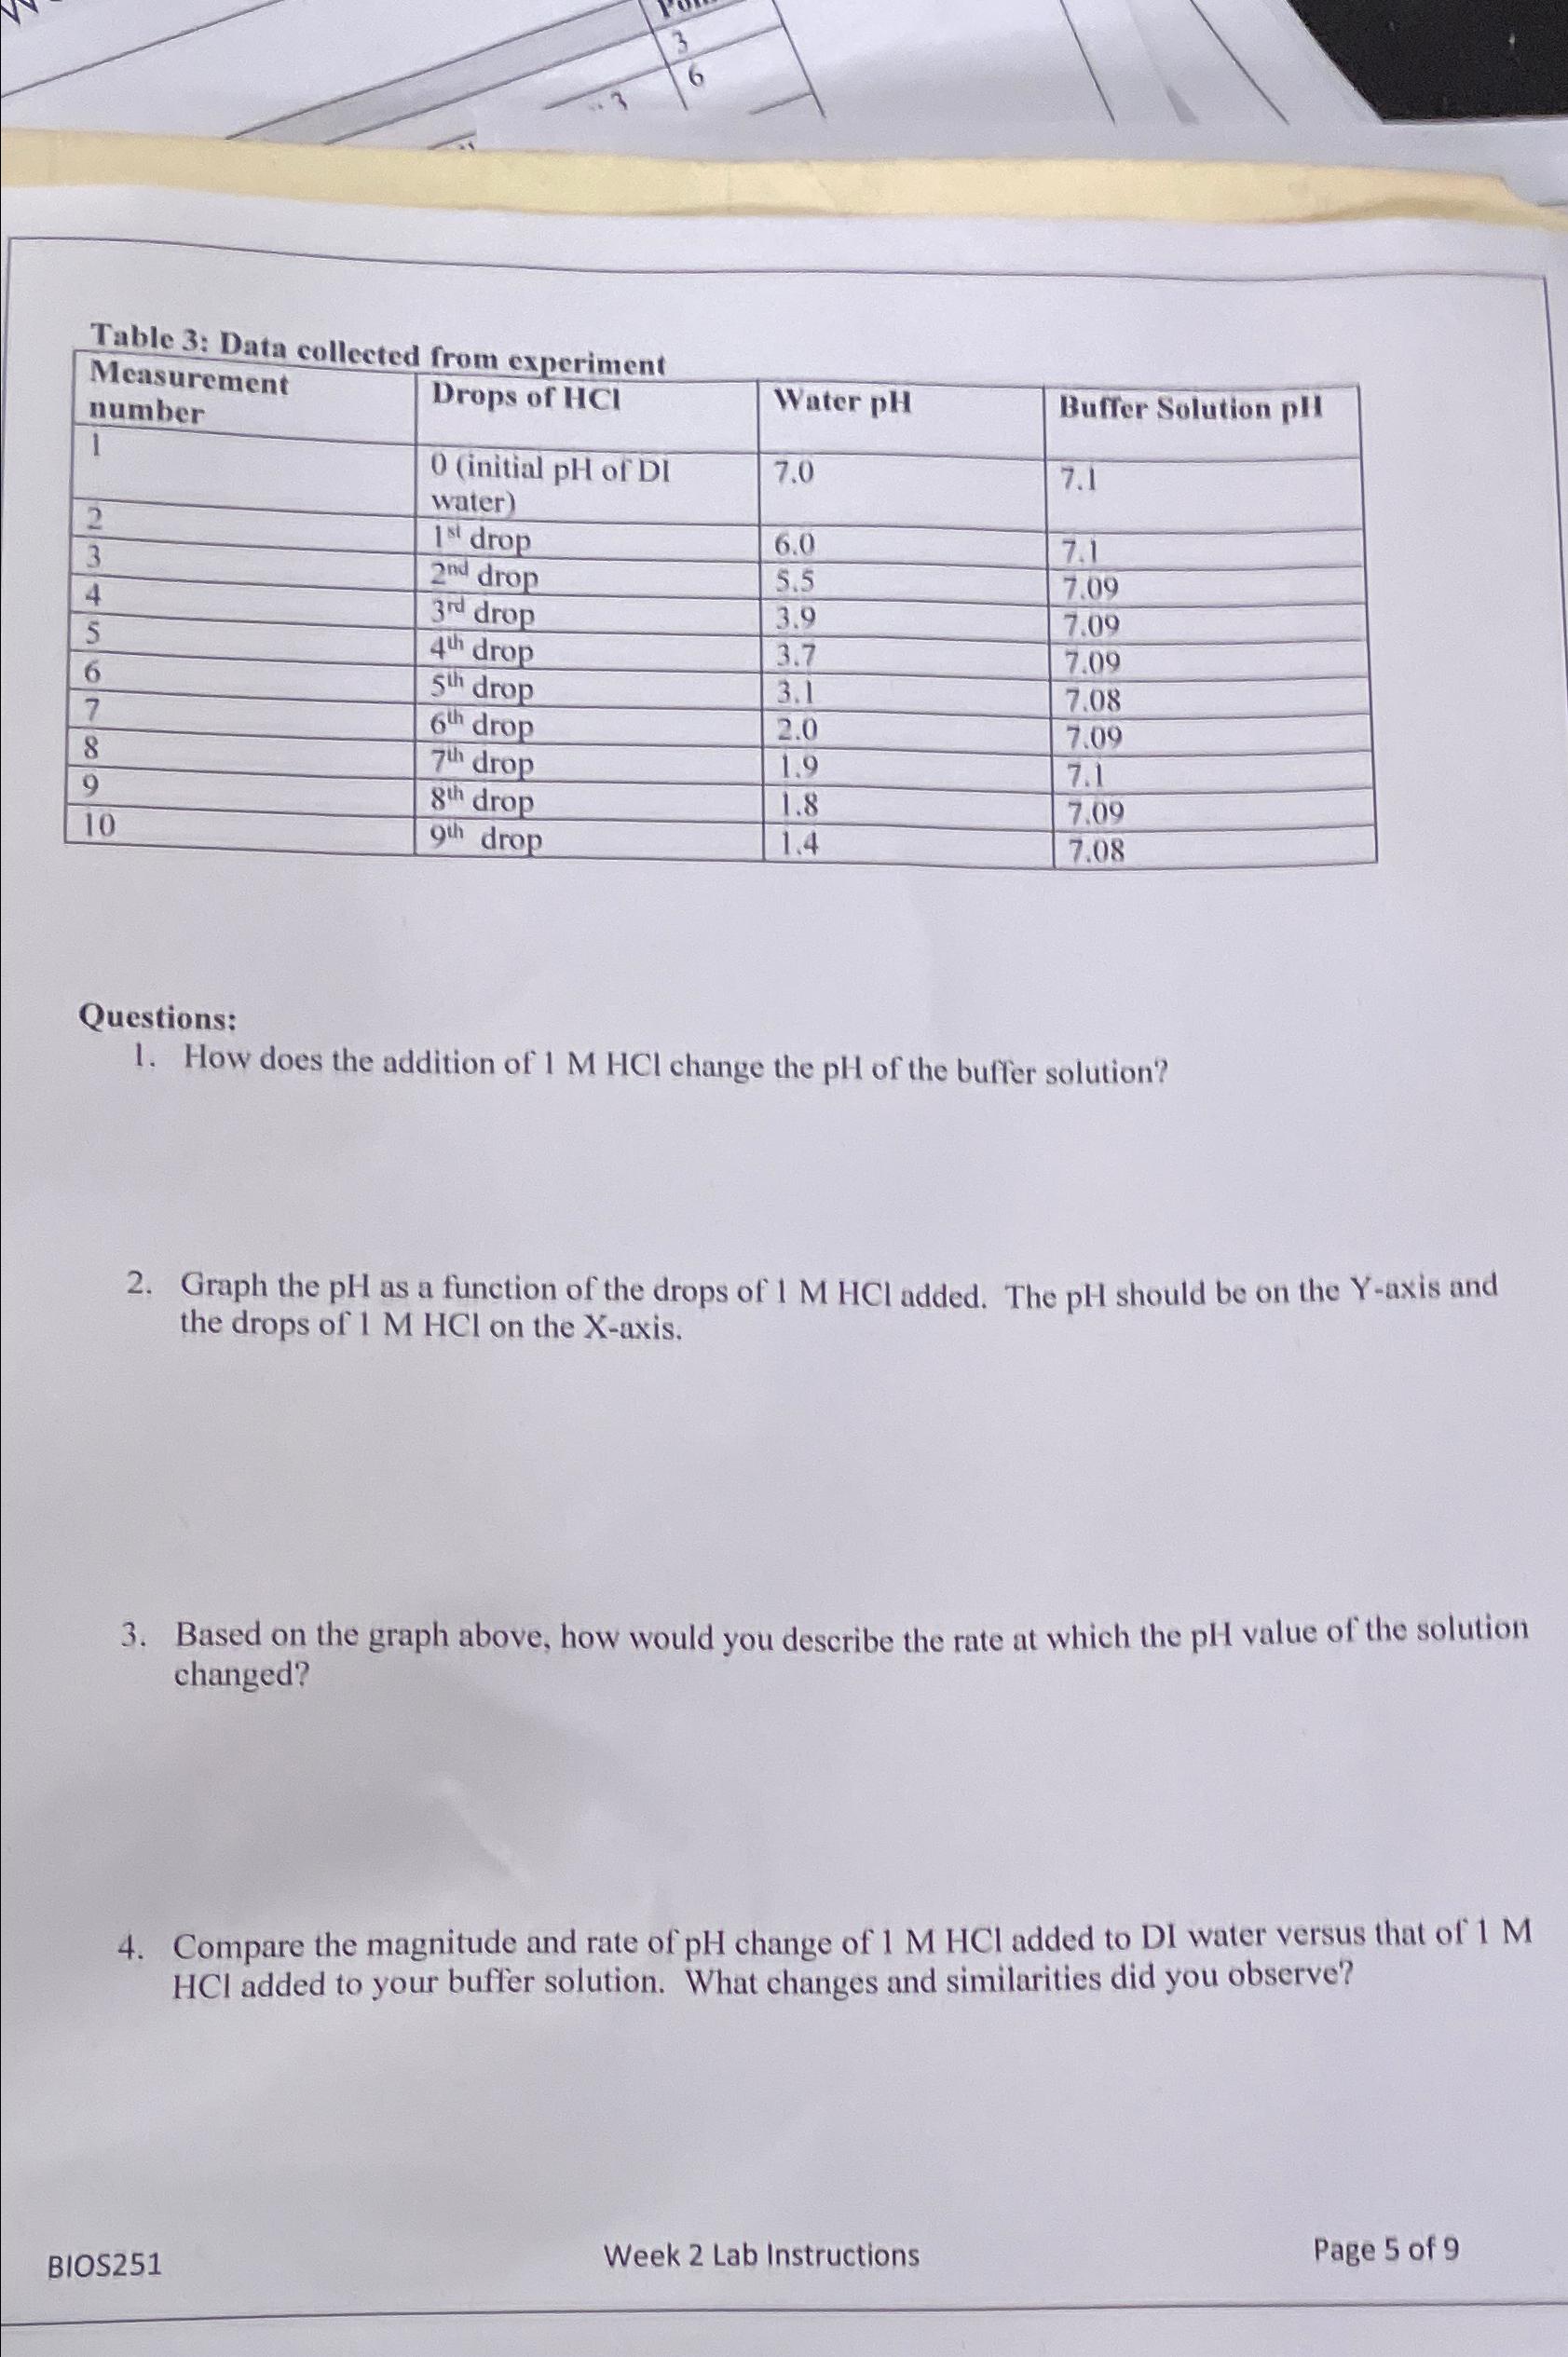
Table 3: Data collected from experiment table[[table[[Measurement],[number]],Drops of HCI ,Water pH ,Buffer Solution pHI],[1,table[[0 (initial pH of DI],[water)]],7.0,7.1],[2, 1^(st ) drop,6.0,7.1],[3, 2^(nd ) drop,5.5,7.09],[4, 3^(dr
Table 3: Data collected from experiment\ \\\\table[[\\\\table[[Measurement],[number]],Drops of
HCI,Water
pH,Buffer Solution pHI],[1,\\\\table[[0 (initial pH of DI],[water)]],7.0,7.1],[2,
1^(st )drop,6.0,7.1],[3,
2^(nd )drop,5.5,7.09],[4,
3^(dr )drop,3.9,7.09],[5,
4^(th )drop,3.7,7.09],[6,
5^(th )drop,3.1,7.08],[7,
6^(th )drop,2.0,7.09],[8,
7^(th )drop,1.9,7.1],[9,
8^(th )drop,1.8,7.09],[10,
9^(th )drop,1.4,7.08]]\ Questions:\ How does the addition of
1MHClchange the
pHof the buffer solution?\ Graph the
pHas a function of the drops of
1MHCladded. The
pHshould be on the
Y-axis and the drops of
1MHClon the X-axis.\ Based on the graph above, how would you describe the rate at which the
pHvalue of the solution changed?\ Compare the magnitude and rate of
pHchange of
1MHCladded to
DIwater versus that of
1M
HCladded to your buffer solution. What changes and similarities did you observe?\ BIOS251\ Week 2 Lab Instructions\ Page 5 of 9
Step by Step Solution
There are 3 Steps involved in it
Step: 1

Get Instant Access to Expert-Tailored Solutions
See step-by-step solutions with expert insights and AI powered tools for academic success
Step: 2

Step: 3
Ace Your Homework with AI
Get the answers you need in no time with our AI-driven, step-by-step assistance
Get Started
An Introduction To Fluid Mechanics
Authors: Faith A. Morrison
1st Edition
1107003539, 9781107003538