Answered step by step
Verified Expert Solution
Question
1 Approved Answer
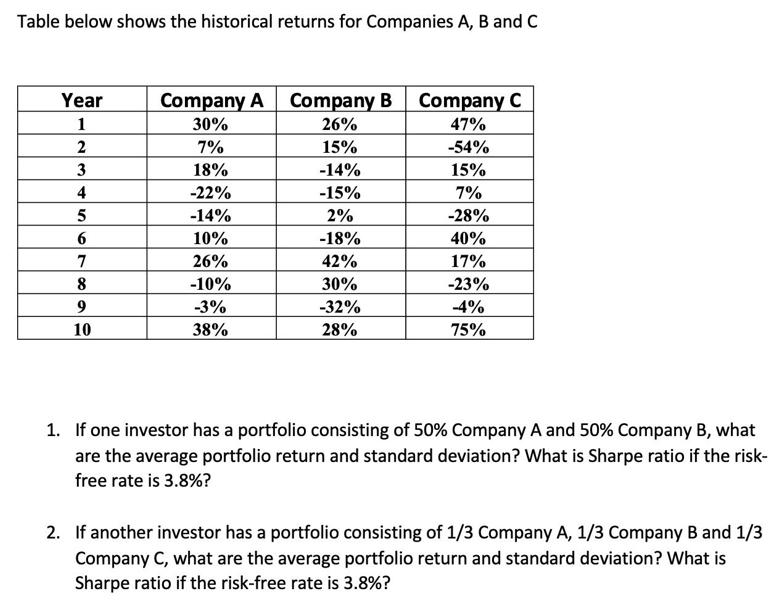
Table below shows the historical returns for Companies A, B and C Year 1 2 3 4 5 6 7 8 9 10 Company

![]()
Table below shows the historical returns for Companies A, B and C Year 1 2 3 4 5 6 7 8 9 10 Company A Company B Company C 30% 26% 47% 7% 15% -54% 18% -14% -22% -15% -14% 2% 10% 26% -10% -3% 38% -18% 42% 30% -32% 28% 15% 7% -28% 40% 17% -23% -4% 75% 1. If one investor has a portfolio consisting of 50% Company A and 50% Company B, what are the average portfolio return and standard deviation? What is Sharpe ratio if the risk- free rate is 3.8%? 2. If another investor has a portfolio consisting of 1/3 Company A, 1/3 Company B and 1/3 Company C, what are the average portfolio return and standard deviation? What is Sharpe ratio if the risk-free rate is 3.8%? 3. What would happen to the portfolio risk if more and more randomly selected stocks were added?
Step by Step Solution
★★★★★
3.29 Rating (155 Votes )
There are 3 Steps involved in it
Step: 1
To calculate the average portfolio return and standard deviation for the given portfolios well use the historical returns provided Lets calculate the ...
Get Instant Access to Expert-Tailored Solutions
See step-by-step solutions with expert insights and AI powered tools for academic success
Step: 2

Step: 3

Ace Your Homework with AI
Get the answers you need in no time with our AI-driven, step-by-step assistance
Get Started


