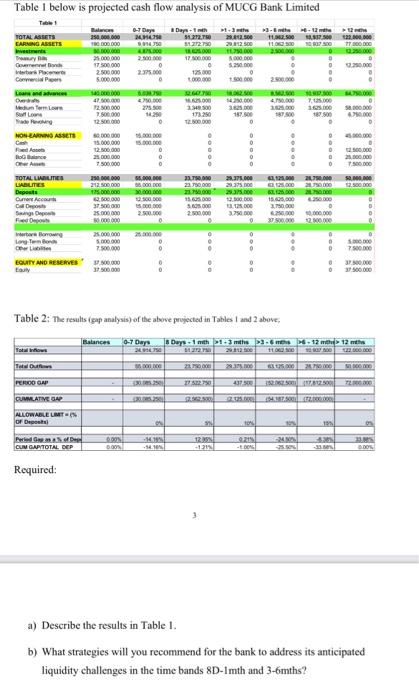
Table I below is projected cash flow analysis of MUCG Bank Limited Days-1 12 mm Balances 250.000.000 0-7 Days 24,34758 9914.750 TOTAL ASSETS CARNING ASSETS 1-3 51.272.750 29412500 51.272.750 29 812 500 3-E6-12 m 11,00 500 13,537.500 11,062 500 10807500 122,000,000 10.000.000 77.000.000 0.000000 4X75.000 165.000 11,750.000 2.500.000 12.250.000 000.000 2.500.000 17.500.000 5.000.000 . Investments Treasury Goverennet Bon Interbork Place Commercial Pr 17.500.000 0 0 5.250.000 0 12.250.000 2.500.000 2.375.000 0 1.500.000 5.000.000 0 1.000.000 2.500,000 140.000.000 500750 32.607.30 18:002500 3097500 Loans and advances Overras 47.500.000 4.750.000 14.625.000 14.250.000 4,750,000 7,125.000 Medium Term Lon 72.500.000 275.500 3.625.000 1425.000 1625.000 58.000.000 Staff Lo 7.500.000 14.250 3.349.500 173.250 12.500.000 187.500 187.500 187.500 4.750.000 hade ing 12.500.000 0 D NON-EARNING ASSETS 60.000.000 15.000000 45.000.000 15,000,000 15.000.000 0 0 D Cash FA 12.500.000 0 0 0 0 12.500.000 Bone 0 25.000.000 25.000.000 7.500.000 0 0 7.500.000 33.750.000 29.375.000 52,00 TOTAL LIABILITIES LIABILITIES Deposts Current Accounts 12.500.000 43,125,000 21.750.000 29.375.000 62,125,000 21.750.000 29.375.000 62125.000 2.750.000 23,790,000 21.750,000 250.000.000 55.000.000 212.500.000 55,000,000 175.000.000 30.000.000 62.500,000 12.500.000 37.500.000 15.000.000 2.500.000 15.625.000 12.500.000 15.625,000 4.250.000 5.625.000 13,125.000 3.750.000 Calle Sing Dep 25.000.000 3.750 000 250,000 10.000.000 50000000 0 0 37 500,000 12.500.000 Interbore Borrowing 25.000.000 25.000.000 0 * 5,000.000 0 5.000.000 Long-Term Bond OL 7.500.000 0 0 0 7.500.000 0 0 EQUITY AND RESERVES 37.500.000 tauty 37.500.000 37.500.000 37.500.000 0 Table 2: The results (gap analysis) of the above projected in Tables 1 and 2 above; Balances 0-7 Days 8 Days-1 mith 1-3 miths 3-6mths 6-12mth> 12 mts Total Inflows 24.914.750 51.272.750 291200 11.002500 Total Outf 55.000000 21,790,000 29.375.000 43 25.000 24.750.000 1 000 000 PERIOD GAP 30.05.250 27522750 437.500 152.0625000 157812.500 72.000.000 CUMMATIVE GAP 2501 $2.562.500 2.325.000 124.387.5000 72.000.000 ALLOWABLE LIMET(% OF Depot on N 10% M 125 m Pried Gof Dep 0.00% -10195 12.95% 9215 -24,30% 43 31985 CUM GAPTOTAL DEP 0.00% -54. 10% +1.21% -100% -25.50% 33.60 0.00% Required: a) Describe the results in Table 1. b) What strategies will you recommend for the bank to address its anticipated liquidity challenges in the time bands 8D-1mth and 3-6mths? 0 Table I below is projected cash flow analysis of MUCG Bank Limited Days-1 12 mm Balances 250.000.000 0-7 Days 24,34758 9914.750 TOTAL ASSETS CARNING ASSETS 1-3 51.272.750 29412500 51.272.750 29 812 500 3-E6-12 m 11,00 500 13,537.500 11,062 500 10807500 122,000,000 10.000.000 77.000.000 0.000000 4X75.000 165.000 11,750.000 2.500.000 12.250.000 000.000 2.500.000 17.500.000 5.000.000 . Investments Treasury Goverennet Bon Interbork Place Commercial Pr 17.500.000 0 0 5.250.000 0 12.250.000 2.500.000 2.375.000 0 1.500.000 5.000.000 0 1.000.000 2.500,000 140.000.000 500750 32.607.30 18:002500 3097500 Loans and advances Overras 47.500.000 4.750.000 14.625.000 14.250.000 4,750,000 7,125.000 Medium Term Lon 72.500.000 275.500 3.625.000 1425.000 1625.000 58.000.000 Staff Lo 7.500.000 14.250 3.349.500 173.250 12.500.000 187.500 187.500 187.500 4.750.000 hade ing 12.500.000 0 D NON-EARNING ASSETS 60.000.000 15.000000 45.000.000 15,000,000 15.000.000 0 0 D Cash FA 12.500.000 0 0 0 0 12.500.000 Bone 0 25.000.000 25.000.000 7.500.000 0 0 7.500.000 33.750.000 29.375.000 52,00 TOTAL LIABILITIES LIABILITIES Deposts Current Accounts 12.500.000 43,125,000 21.750.000 29.375.000 62,125,000 21.750.000 29.375.000 62125.000 2.750.000 23,790,000 21.750,000 250.000.000 55.000.000 212.500.000 55,000,000 175.000.000 30.000.000 62.500,000 12.500.000 37.500.000 15.000.000 2.500.000 15.625.000 12.500.000 15.625,000 4.250.000 5.625.000 13,125.000 3.750.000 Calle Sing Dep 25.000.000 3.750 000 250,000 10.000.000 50000000 0 0 37 500,000 12.500.000 Interbore Borrowing 25.000.000 25.000.000 0 * 5,000.000 0 5.000.000 Long-Term Bond OL 7.500.000 0 0 0 7.500.000 0 0 EQUITY AND RESERVES 37.500.000 tauty 37.500.000 37.500.000 37.500.000 0 Table 2: The results (gap analysis) of the above projected in Tables 1 and 2 above; Balances 0-7 Days 8 Days-1 mith 1-3 miths 3-6mths 6-12mth> 12 mts Total Inflows 24.914.750 51.272.750 291200 11.002500 Total Outf 55.000000 21,790,000 29.375.000 43 25.000 24.750.000 1 000 000 PERIOD GAP 30.05.250 27522750 437.500 152.0625000 157812.500 72.000.000 CUMMATIVE GAP 2501 $2.562.500 2.325.000 124.387.5000 72.000.000 ALLOWABLE LIMET(% OF Depot on N 10% M 125 m Pried Gof Dep 0.00% -10195 12.95% 9215 -24,30% 43 31985 CUM GAPTOTAL DEP 0.00% -54. 10% +1.21% -100% -25.50% 33.60 0.00% Required: a) Describe the results in Table 1. b) What strategies will you recommend for the bank to address its anticipated liquidity challenges in the time bands 8D-1mth and 3-6mths? 0


