Answered step by step
Verified Expert Solution
Question
1 Approved Answer
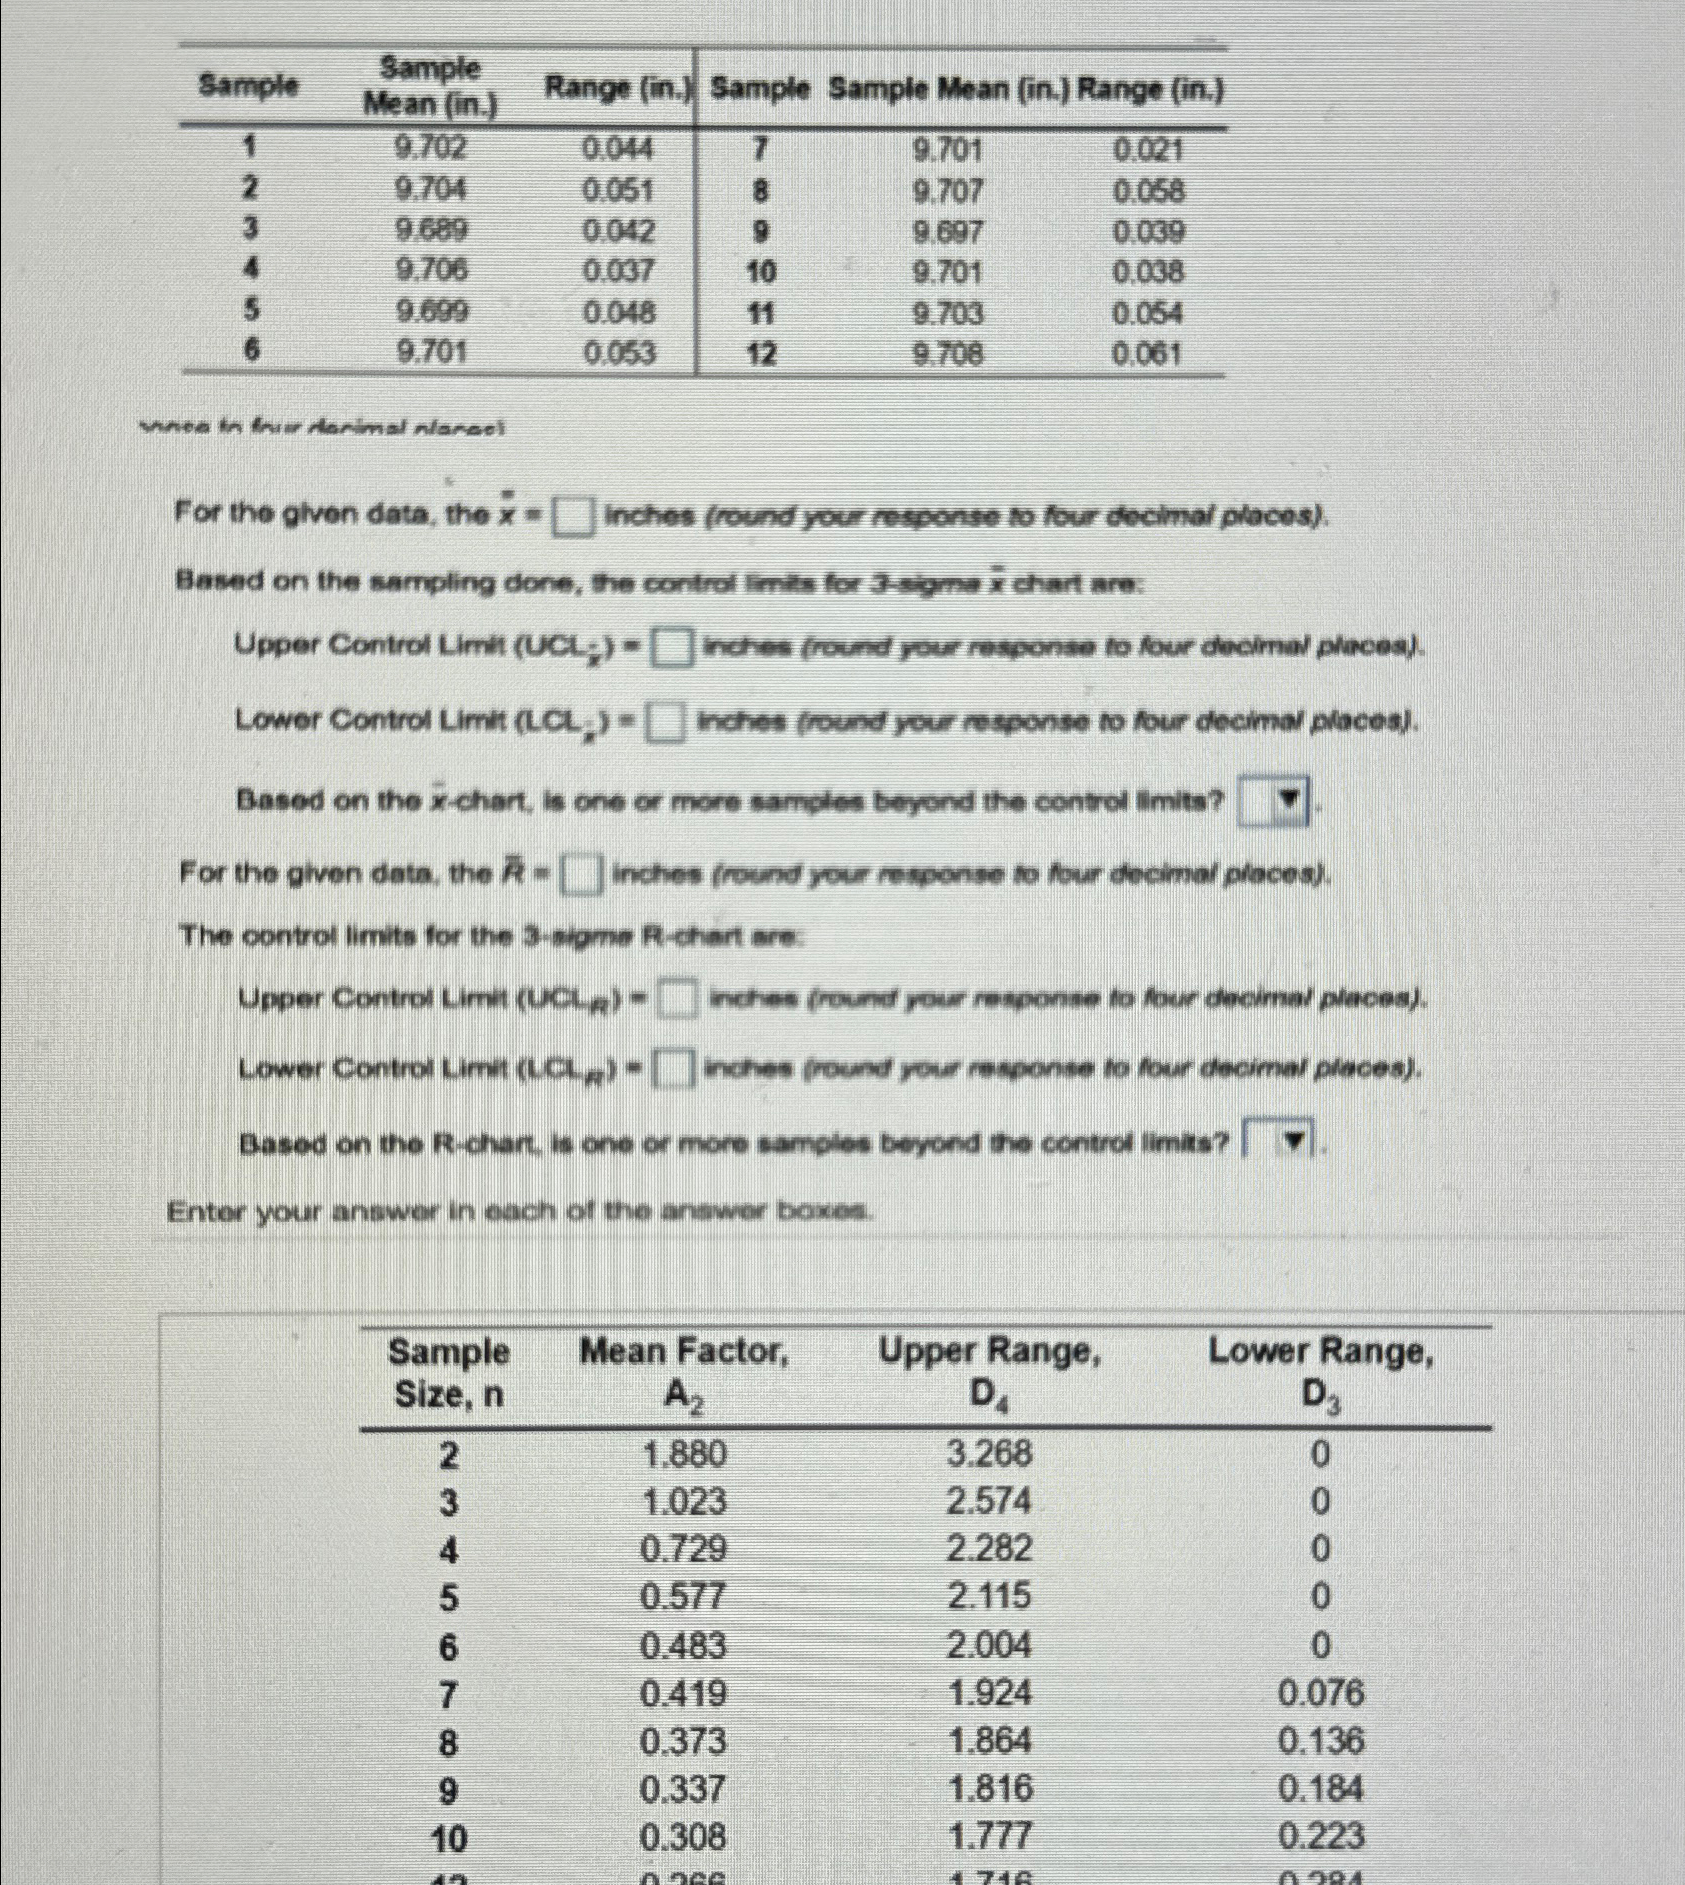
table [ [ Sample , table [ [ Sample ] , [ Mean ( in . ) ] ] , Range ( in
tableSampletableSampleMean inRange inSample Sample Mean in Range in
unee in tur derimal nlareel
For the glvon data, the Inches round your response to four decimal places
Based on the sampling dore, the control limis for stgma chart are:
Lowor Control Limit hohes round your wesponse to four decimal ploces
Based on the chart, is one or more samples beyond the control limits
For the given data, the inches round your respense fo four decimal ploces
The control limits for the sigme Achart are:
Enter your anawor in each of the anawer boxes.
tabletableSampleSize

Step by Step Solution
There are 3 Steps involved in it
Step: 1

Get Instant Access to Expert-Tailored Solutions
See step-by-step solutions with expert insights and AI powered tools for academic success
Step: 2

Step: 3

Ace Your Homework with AI
Get the answers you need in no time with our AI-driven, step-by-step assistance
Get Started


