Table :
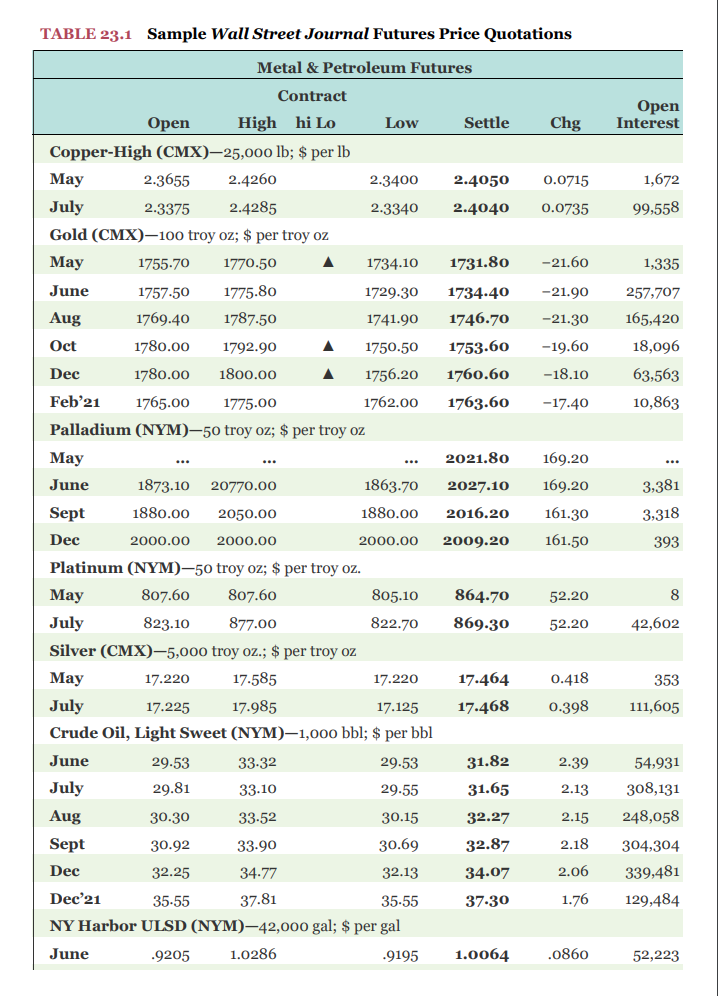
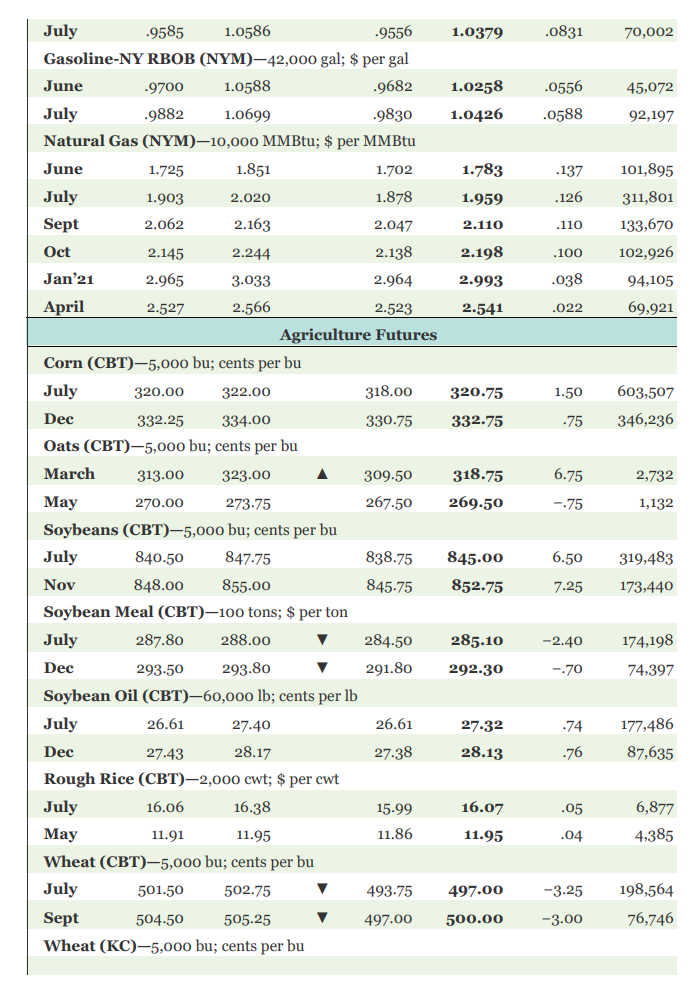
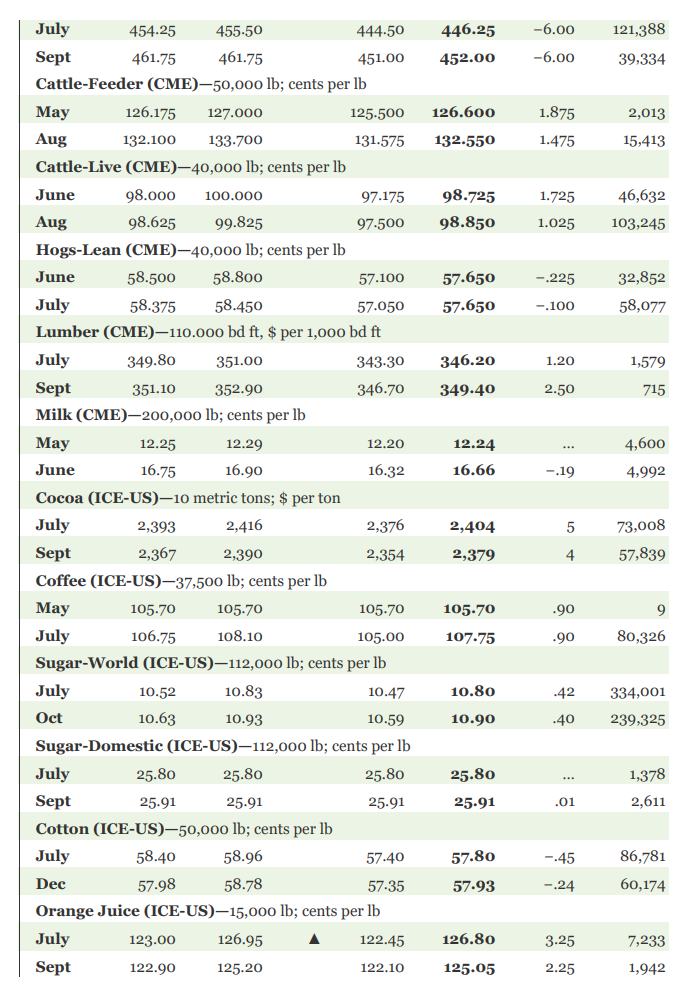
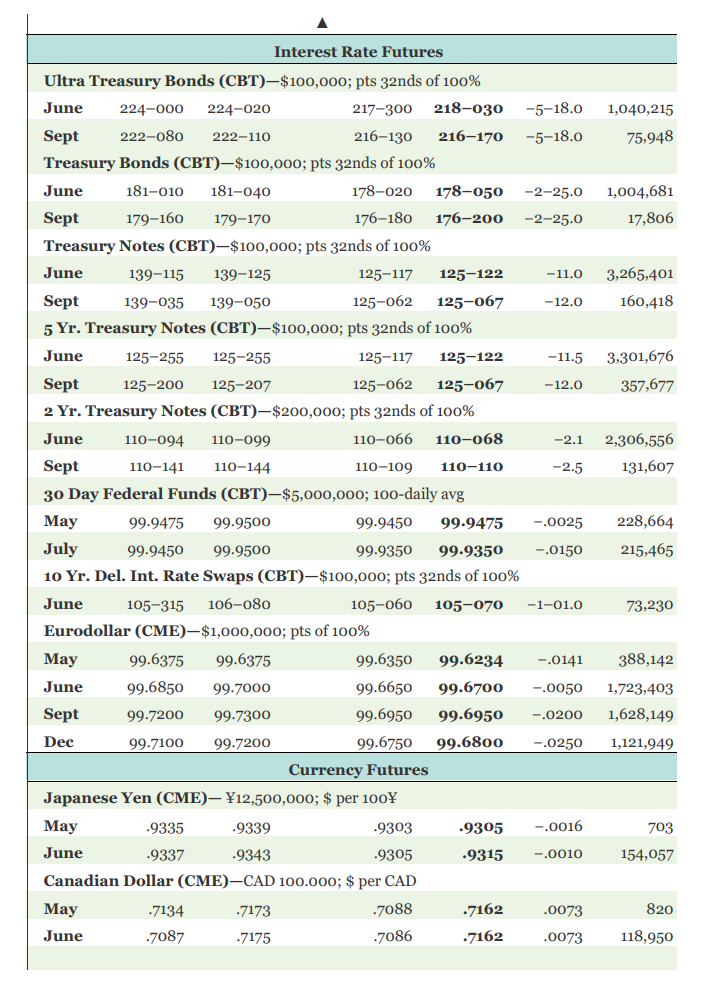
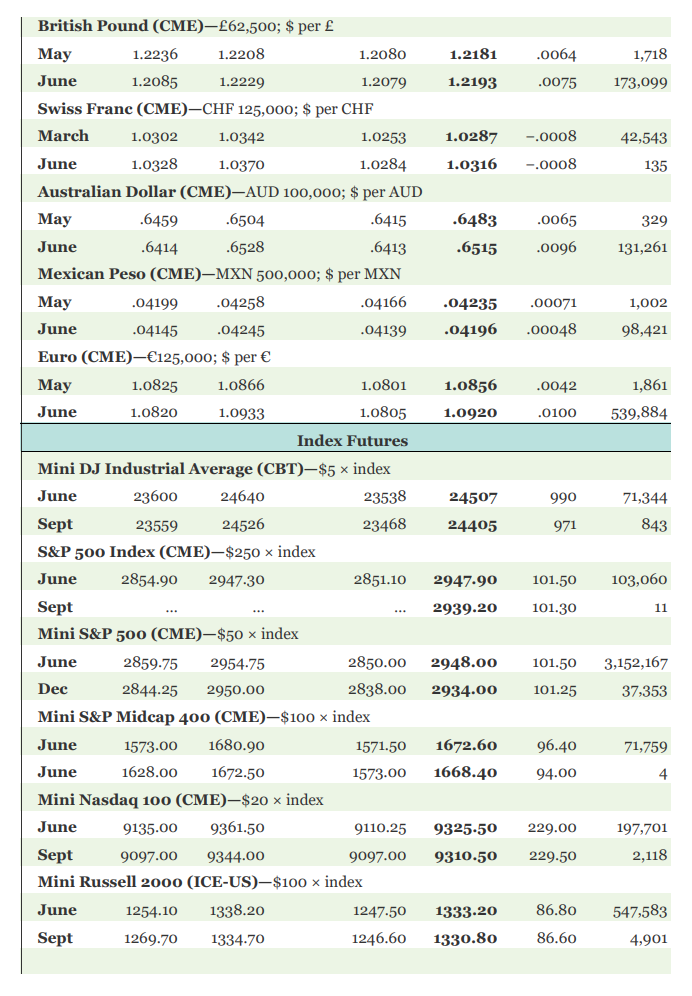
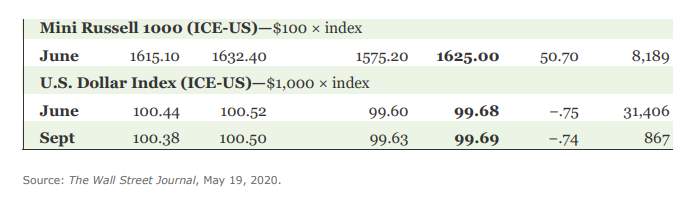
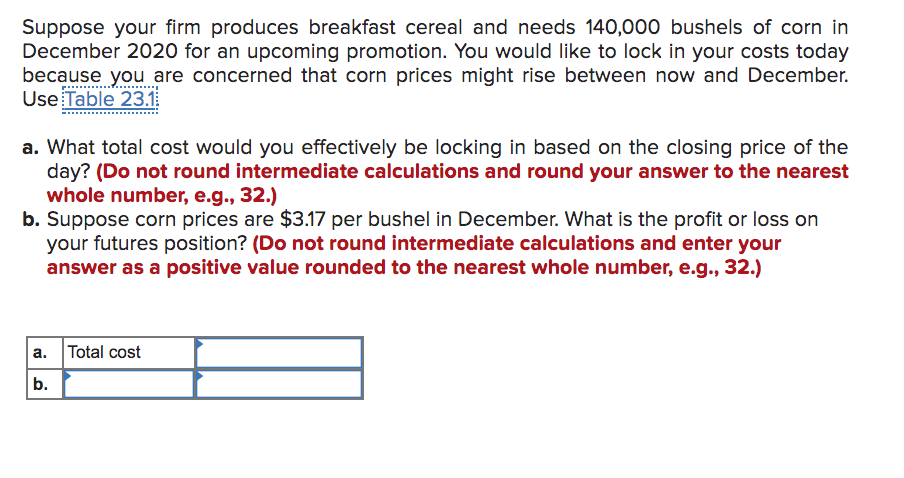
Suppose your firm produces breakfast cereal and needs 140,000 bushels of corn in December 2020 for an upcoming promotion. You would like to lock in your costs today because you are concerned that corn prices might rise between now and December. Use Table 23.1 a. What total cost would you effectively be locking in based on the closing price of the day? (Do not round intermediate calculations and round your answer to the nearest whole number, e.g., 32.) b. Suppose corn prices are $3.17 per bushel in December. What is the profit or loss on your futures position? (Do not round intermediate calculations and enter your answer as a positive value rounded to the nearest whole number, e.g., 32.) a. Total cost b. TABLE 23.1 Sample Wall Street Journal Futures Price Quotations Chg Open Interest 0.0715 1,672 99,558 0.0735 -21.60 1,335 -21.90 -21.30 -19.60 257,707 165,420 18,096 -18.10 63,563 -17.40 10,863 169.20 169.20 Metal & Petroleum Futures Contract Open High hi Lo Low Settle Copper-High (CMX)25,000 lb; $ per lb May 2.3655 2.4260 2.3400 2.4050 July 2.3375 2.4285 2.3340 2.4040 Gold (CMX)-100 troy oz; $ per troy oz May 1755.70 1770.50 1734.10 1731.80 June 1757.50 1775.80 1729.30 1734.40 Aug 1769.40 1787.50 1741.90 1746.70 Oct 1780.00 1792.90 1750.50 1753.60 Dec 1780.00 1800.00 1756.20 1760.60 Feb 21 1765.00 1775.00 1762.00 1763.60 Palladium (NYM)-50 troy oz; $ per troy oz May 2021.80 June 1873.10 20770.00 1863.70 2027.10 Sept 1880.00 2050.00 1880.00 2016.20 Dec 2000.00 2000.00 2000.00 2009.20 Platinum (NYM)-50 troy oz; $ per troy oz. May 807.60 807.60 805.10 864.70 July 823.10 877.00 822.70 869-30 Silver (CMX)-5,000 troy oz.; $ per troy oz May 17.220 17.585 17.220 17.464 July 17.225 17.985 17.125 17.468 Crude Oil, Light Sweet (NYM)-1,000 bbl; $ per bbl June 29.53 33-32 29.53 31.82 July 29.81 33.10 29.55 31.65 Aug 30.30 33.52 30.15 32.27 Sept 30.92 33.90 30.69 32.87 Dec 32.25 34.77 32.13 34.07 Dec 21 35-55 37.81 35-55 37-30 NY Harbor ULSD (NYM)-42,000 gal; $ per gal June .9205 1.0286 .9195 1.0064 3,381 3,318 161.30 161.50 393 52.20 8 52.20 42,602 353 0.418 0.398 111,605 2.39 2.13 2.15 54,931 308,131 248,058 304,304 339,481 129,484 2.18 2.06 1.76 .0860 52,223 .0831 70,002 45,072 .0556 .0588 92,197 .137 .126 .110 101,895 311,801 133,670 102,926 94,105 .100 .038 .022 69,921 1.50 603,507 -75 346,236 6.75 July .9585 1.0586 .9556 1.0379 Gasoline-NY RBOB (NYM)-42,000 gal; $ per gal June .9700 1.0588 .9682 1.0258 July .9882 1.0699 .9830 1.0426 Natural Gas (NYM)-10,000 MMBtu; $ per MMBtu June 1.725 1.851 1.702 1.783 July 1.903 2.020 1.878 1.959 Sept 2.062 2.163 2.047 2.110 Oct 2.145 2.244 2.138 2.198 Jan'21 2.965 3.033 2.964 2.993 April 2.527 2.566 2.523 2.541 Agriculture Futures Corn (CBT)-5,000 bu; cents per bu July 320.00 322.00 318.00 320.75 Dec 332.25 334.00 330.75 332.75 Oats (CBT)-5,000 bu; cents per bu March 313.00 323.00 A 309.50 318.75 May 270.00 273.75 267-50 269.50 Soybeans (CBT)5,000 bu; cents per bu July 840.50 847.75 845.00 Nov 848.00 855.00 845.75 852.75 Soybean Meal (CBT)-100 tons; $ per ton July 287.80 288.00 284.50 285.10 293.50 293.80 291.80 292.30 Soybean Oil (CBT)-60,000 lb; cents per lb July 26.61 27.40 26.61 27-32 Dec 27.43 28.17 27.38 28.13 Rough Rice (CBT)2,000 cwt; $ per cwt July 16.06 16.38 15.99 16.07 May 11.95 11.86 11.95 Wheat (CBT)5,000 bu; cents per bu July 501.50 502.75 V 493.75 497.00 Sept 504-50 505.25 497.00 500.00 Wheat (KC)-5,000 bu; cents per bu 2,732 1,132 --75 838.75 6.50 319,483 7.25 173,440 -2.40 174,198 Dec -.70 74,397 -74 177,486 .76 87,635 .05 6,877 11.91 .04 4,385 -3.25 198,564 -3.00 76,746 446.25 -6.00 121,388 452.00 -6.00 39,334 126.600 1.875 2,013 132.550 1.475 15,413 1.725 98.725 98.850 46,632 103,245 1.025 -.225 32,852 57.650 57.650 -.100 58,077 349.80 346.20 1.20 1,579 349.40 2.50 715 4,600 12.24 16.66 -.19 4,992 July 454.25 455-50 444-50 Sept 461.75 461.75 451.00 Cattle-Feeder (CME)-50,000 lb; cents per lb May 126.175 127.000 125.500 Aug 132.100 133.700 131.575 Cattle-Live (CME)-40,000 lb; cents per lb June 98.000 100.000 97.175 Aug 98.625 99.825 97.500 Hogs-Lean (CME)40,000 lb; cents per lb June 58.500 58.800 57.100 July 58.375 58.450 57.050 Lumber (CME)110.000 bd ft, $ per 1,000 bd ft July 351.00 343-30 Sept 351.10 352.90 346.70 Milk (CME)-200,000 lb; cents per lb May 12.25 12.29 12.20 June 16.75 16.90 16.32 Cocoa (ICE-US)-10 metric tons; $ per ton July 2,393 2,416 2,376 Sept 2,367 2,390 2,354 Coffee (ICE-US)-37,500 lb; cents per lb May 105.70 105.70 105.70 July 106.75 108.10 105.00 Sugar-World (ICE-US)-112,000 lb; cents per lb 10.83 10.47 Oct 10.63 10.93 10.59 Sugar-Domestic (ICE-US)-112,000 lb; cents per lb July 25.80 25.80 25.80 Sept 25.91 25.91 25.91 Cotton (ICE-US)-50,000 lb; cents per lb July 58.40 58.96 57.40 Dec 57.98 58.78 57.35 Orange Juice (ICE-US)15,000 lb; cents per lb July 123.00 126.95 122.45 Sept 122.90 125.20 122.10 2,404 5 73,008 2,379 4 57,839 105.70 .90 9 107.75 .90 80,326 July 10.52 10.80 .42 334,001 10.90 .40 239,325 25.80 1,378 25.91 .01 2,611 57.80 -.45 86,781 57.93 -.24 60,174 126.80 3.25 7,233 125.05 2.25 1,942 1,040,215 75,948 1,004,681 17,806 3,265,401 160,418 3,301,676 357,677 2,306,556 131,607 Interest Rate Futures Ultra Treasury Bonds (CBT)-$100,000; pts 32nds of 100% June 224-000 224-020 217-300 218-030 -5-18.0 Sept 222-080 222-110 216-130 216-170 -5-18.0 Treasury Bonds (CBT)-$100,000; pts 32nds of 100% June 181-010 181-040 178-020 178-050 -2-25.0 Sept 179-160 179-170 176-180 176-200 -2-25.0 Treasury Notes (CBT)-$100,000; pts 32nds of 100% June 139-115 139-125 125-117 125-122 - 11.0 Sept 139-035 139-050 125-062 125-067 - 12.0 5 Yr. Treasury Notes (CBT)-$100,000; pts 32nds of 100% June 125-255 125-255 125-117 125-122 -11.5 Sept 125-200 125-207 125-062 125-067 -12.0 2 Yr. Treasury Notes (CBT)-$200,000; pts 32nds of 100% June 110-094 110-099 110-066 110-068 -2.1 Sept 110-141 110-144 110-109 110-110 -2.5 30 Day Federal Funds (CBT)-$5,000,000; 100-daily avg May 99.9475 99.9500 99.9450 99.9475 -.0025 July 99.9450 99.9500 99.9350 99.9350 -.0150 10 Yr. Del. Int. Rate Swaps (CBT)-$100,000; pts 32nds of 100% June 105-315 106-080 105-060 105-070 -1-01.0 Eurodollar (CME)-$1,000,000; pts of 100% May 99.6375 99.6375 99.6350 99.6234 -.0141 June 99.6850 99.7000 99.6650 99.6700 -.0050 Sept 99.7200 99.7300 99.6950 99.6950 -.0200 Dec 99.7100 99.7200 99.6750 99.6800 -.0250 Currency Futures Japanese Yen (CME)- 12,500,000; $ per 100 May .9335 .9339 .9303 .9305 -.0016 June .9337 .9343 .9305 .9315 -.0010 Canadian Dollar (CME)-CAD 100.000; $ per CAD May .7134 .7173 .7088 .7162 .0073 June .7087 .7175 .7086 .7162 .0073 228,664 215,465 73,230 388,142 1,723,403 1,628,149 1,121,949 703 154,057 820 118,950 British Pound (CME)-62,500; $ per 1.2181 .0064 1,718 1.2193 .0075 173,099 1.0287 -.0008 42,543 1.0316 -.0008 135 .6483 .0065 329 May 1.2236 1.2208 1.2080 June 1.2085 1.2229 1.2079 Swiss Franc (CME)-CHF 125,000; $ per CHF March 1.0302 1.0342 1.0253 June 1.0328 1.0370 1.0284 Australian Dollar (CME)-AUD 100,000; $ per AUD May .6459 .6504 .6415 June .6414 .6528 .6413 Mexican Peso (CME)-MXN 500,000; $ per MXN May .04199 .04258 .04166 June .04145 .04245 .04139 Euro (CME)-125,000; $ per May 1.0825 1.0866 1.0801 June 1.0820 1.0933 1.0805 .6515 .0096 131,261 .00071 1,002 .04235 .04196 .00048 98,421 1.0856 .0042 1,861 1.0920 .0100 539,884 Index Futures 24507 990 71,344 24405 971 843 2947.90 101.50 103,060 2939.20 101.30 11 2948.00 101.50 3,152,167 2934.00 101.25 37,353 Mini DJ Industrial Average (CBT)-$5 x index June 23600 24640 23538 Sept 23559 24526 23468 S&P 500 Index (CME)-$250 x index June 2854.90 2947.30 2851.10 Sept Mini S&P 500 (CME)-$50 x index June 2859.75 2954.75 2850.00 Dec 2844.25 2950.00 2838.00 Mini S&P Midcap 400 (CME)-$100 x index June 1573.00 1680.90 1571.50 1628.00 1672.50 1573.00 Mini Nasdaq 100 (CME)-$20 x index June 9135.00 9361.50 9110.25 Sept 9097.00 9344.00 9097.00 Mini Russell 2000 (ICE-US)-$100 x index June 1254.10 1338.20 1247.50 Sept 1269.70 1334.70 1246.60 96.40 71,759 1672.60 1668.40 June 94.00 4 9325-50 229.00 197,701 9310.50 229.50 2,118 86.80 547,583 1333.20 1330.80 86.60 4,901 1625.00 50.70 8,189 Mini Russell 1000 (ICE-US)$100 x index June 1615.10 1632.40 1575.20 U.S. Dollar Index (ICE-US)-$1,000 x index June 100.44 100.52 99.60 Sept 100.38 100.50 99.63 99.68 99.69 -.75 -.74 31,406 867 Source: The Wall Street Journal, May 19, 2020